We recently talked about ways to set your customers up to be successful, long-term users of your product. By identifying strong audiences and quickly leading users to their “aha moment,” you can ensure that the right people see the right parts of your product as soon as possible.
But even under the best of circumstances, people drift away. They lose interest. They get distracted by some shiny new thing. They forget about you before your service becomes the habit you want it to become.
For these people, early retention strategies pack no punch. We can't change who these customers are or when they signed up. You can't optimize your signup flow and or new user experience—they've already gone through them. You can't lead users to an aha moment—many of them have already found it.
Instead, you have to win them back.
Timing is everything

If rom-coms teach us anything, it's that winning people back takes a Grand Declaration.
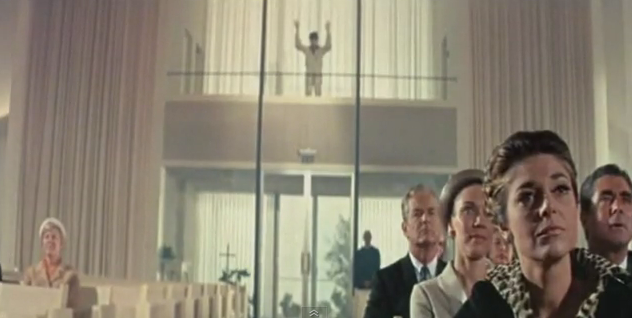
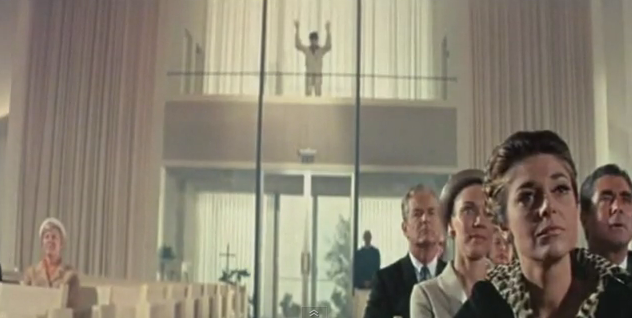
But any Grand Declaration won't do—as Love, Actually makes clear—it has to be a well-timed Grand Declaration. Too early, and it backfires; too late, and they're lost. But if the timing is just right, they can't say no. Julia Stiles did it in the middle of English class, Steve Carell did it in the middle of an 8th-grade graduation, and Dustin Hoffman did it in the middle of a wedding.
As anyone who's purged their inbox of promotional emails knows, the pitfall of many re-engagement campaigns is that they don't know when (or how often) to reach out. Instead of sending out emails on your timeline, it can be far more valuable to send a few well-timed pieces of outreach, just before the user is about to slip away.
In a rom-com, the audience can feel the Grand Declaration coming a mile away. Unfortunately for us, it's not nearly as obvious when a user is about to churn. The time it takes a user to churn varies from product to product. For a daily fitness tracker, three days of inactivity could be a huge warning sign. For a product that helps you pay your rent, even the best customers probably only log in once or twice a month.
To figure out when to reach out, look at your customers' usage patterns. Specifically, you want to determine the length of an absence that indicates a customer is at risk of churning. If you haven't heard or seen a user in two days, are they likely to come back? After 10 days? 20 days?
The chart below (and the associated query) shows how to estimate this. The x-axis displays how many days since you've last heard from a customer. (This doesn't have to be the last login. It could be the last purchase, the last order, the last post, or any other action that you deem important.) The orange line shows the percent of those users who returned at any point in the future.
For this imaginary product (and its sample data!), reaching out to users after a week is ideal, if they haven't come back yet. Re-engagement efforts after a day or two will target many people who'd likely return anyway. After 14 days, however, the return rate starts to flatten. Without an intervention, these people are much more likely to be gone for good. They've already gotten married to some jerk.
Not all love interests users are created equal

Timing can make all the difference, but it's useless if you're not delivering the right message to the right person. Renee Zellweger's character in Bridget Jones's Diary doesn't profess her love for Colin Firth in some flirty email (like the ones she sent to Hugh Grant). She makes a speech in front of a whole crowd of people.
Grant and Firth aren't exactly alike. Neither are your users. It doesn't make sense for a new user who used your product for one day to be on the same timeline and receive the same messaging as a seasoned customer of two years.
You need to personalize the timing and content of your Grand Declaration based on user type. There are many ways to cohort users. Two of the easiest are user age and user activity level. The chart below shows the percentage of users who return after an an absence, much like the first chart above. However, rather than aggregating everyone together into a single line, the grid segments users by the total number of actions they've taken. Again, this could be a different measure depending on your product. It could be purchases, total money spent, invites sent, etc.
From this chart, we can see that life cycles are different for different types of users. For new customers, the first few days are critical. Return rates flatten out quickly though, suggesting these users have yet to form habits and can be pulled back in. For more mature users, habits appear clearly developed. Short absences mean very little, but trouble can emerge very quickly if they break this habit.
For products with large user bases, you can break this segmentation down further by splitting users across multiple dimensions. At Mode, for instance, our users are composed of two types of people—those who frequently write queries and build reports (editors) and those who consume reports (viewers). These users interact with the product in different ways. We might want to segment outreach so that we notify editors about new features in the editor and viewers about updates to the report view.
Win back your users, with a little help from Mode
We can't help you write your Grand Declaration, but we can help you figure out who to target and when. Clone these charts and hook them up to your data. Click “Results à la Mode” at the bottom of the dashboard to open it in Mode, and then click “Clone” in the upper right hand corner. For more on cloning Mode reports, read this documentation.


