


Regardless of the size or purpose of your company, customer service (or success or support) is a crucial part of your customer lifecycle. When properly done, customer service can:
- Increase customer retention
- Help you better understand customer needs, leading to more useful product improvements
- Create brand evangelists
- Increase revenue through upsells
To do all the above, exceptional customer service is key. For that you need a framework to effectively measure and monitor the whole process based on actual data.
Mode’s Customer Success Analyst, Joel Carron, recently wrote about a new way to measure Customer Service called the Customer Service Cube.
Today we’re sharing some examples of how our team at Blendo applied the Customer Service Cube framework to raw Intercom data. We’ve written some queries and visualizations you can use with your own data to measure the three key goals of Customer Service Cube—efficiency, efficacy, and quality.
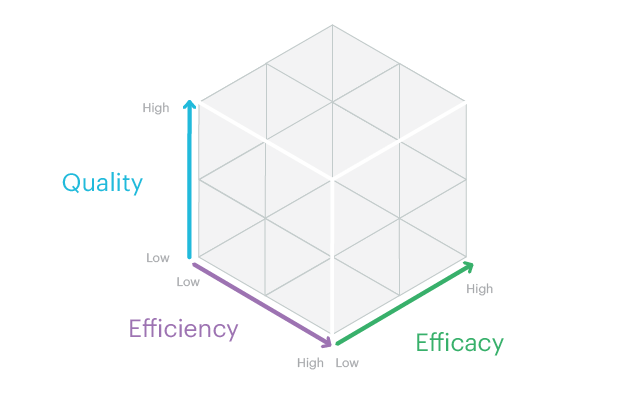
A small refresher on the Customer Service Cube
The Customer Service Cube offers a set of high level dimensions we can use to measure customer service. The three dimensions--or sides of the cube--are:
- Efficiency
- Efficacy
- Quality
Efficiency can be tracked by measuring the time it takes to solve a customer’s problem.
Efficacy can be tracked by measuring the number of interactions required to solve a customer’s issue.
Quality is the trickiest to pin down, since it’s a more subjective measure compared to the other two. Its definition might vary depending on your company and customer service strategy, but typically a customer satisfaction (CSAT) survey is used to measure immediate satisfaction with with a recent customer service interaction.
Raw Intercom data and a bit of SQL
At Blendo, we’ve built a platform for easily collecting and consolidating all your data in a data warehouse like Amazon Redshift. This data may come from a variety of data sources, like our CRM, email marketing, or customer success tools.
Since Intercom is our primary customer communication tool, it was a no-brainer to use Blendo to get all our Intercom data into a centralized place for analysis. Once our data was in Redshift-- raw, updated, and synced--analyzing it with SQL became a no brainer. And this is where Mode comes into play.
With our Redshift instance hooked up to Mode, we can explore up-to-date Intercom data with SQL and build visualizations on top of query results.
Tracking customer service efficiency
When it comes to measuring the efficiency of any process, we usually look the resources consumed during execution. For customer service efficiency, the most common resource we track is time. As Joel suggests in his post, handle time—the total time a representative spends solving an issue—can be used to represent efficiency. But how do we keep track of handle time in Intercom?
To be able to track handle time, we need the information related to conversations with our customers. At this point we’re assuming that these conversations are the result of customer service. Any time we have an Intercom conversation for a purpose other than customer service, we mark it with a tag.
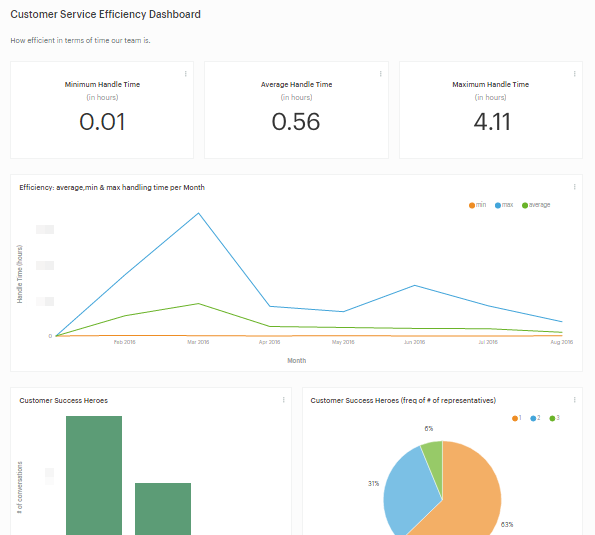
We can query the intercom_conversations table to calculate the min, max, and average handle time for our whole team:
SELECT min(duration_to_solution) AS MIN,
	   max(duration_to_solution) AS MAX,
	   avg(duration_to_solution) AS average
  FROM (
SELECT extract(epoch
  FROM updated_at - created_at) / (60*60) AS duration_to_solution
  FROM intercom_conversations
  WHERE OPEN = FALSE) duration
With a few modifications, you can use this query in your own SQL editor to make this kind of dashboard for your company.
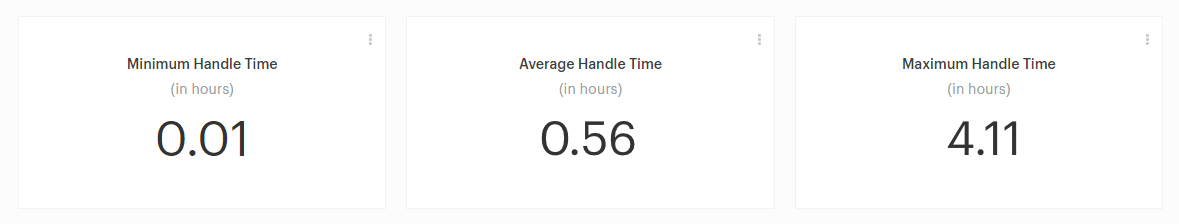
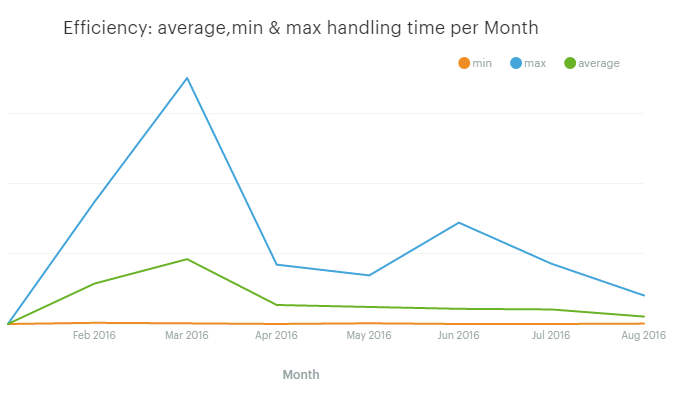
What we care about here is the average handle time, but min and max can also be useful. They might show the lower and upper limits to the performance of our team or point out to an exceptional event that affected our customer service.
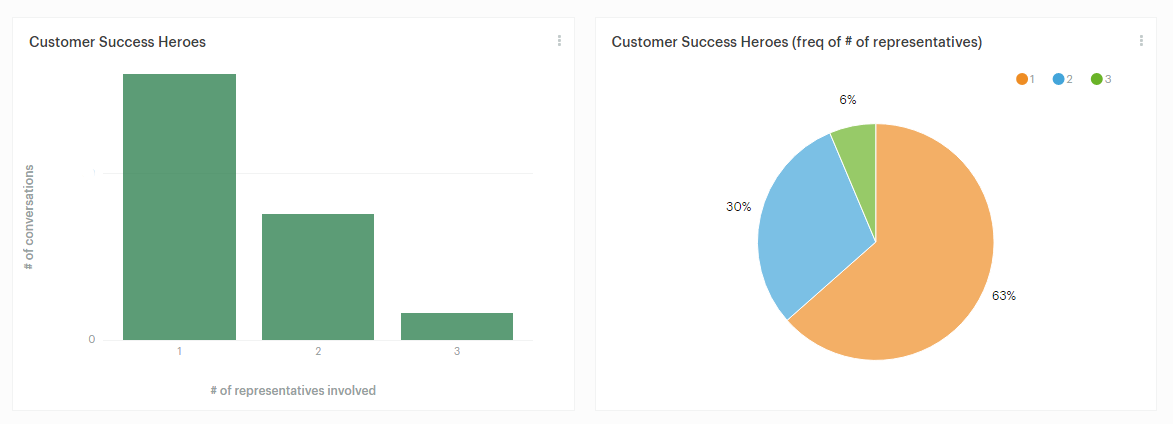
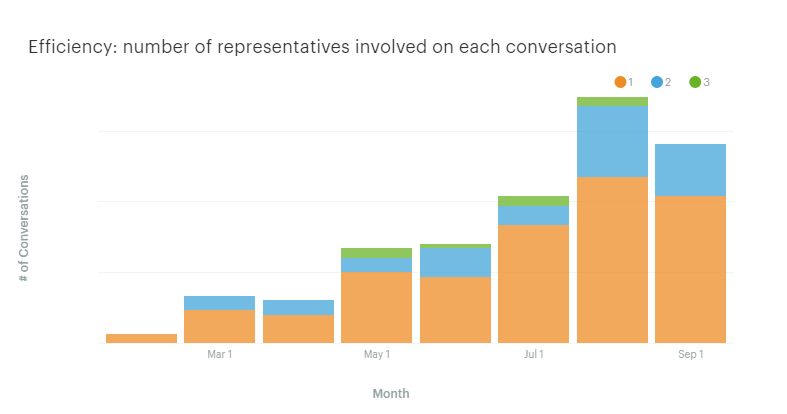
Another metric we can use for customer service efficiency is the number of representatives associated with each ticket. The resolution of a ticket often involves more than one representative. Sometimes someone from the engineering department has to step in. Even if we improve the time it takes to solve a problem, it might require more employees. This is something we want to track! How many representatives are involved per conversation and how frequently?
The intercom_conversations_parts table contains detailed data on Intercom conversations, such as the actual text of the conversation, who started it, and when. We can answer our question using the following SQL query:
	SELECT number_of_assignees AS customer_success_heroes,
		   COUNT(number_of_assignees) AS Frequency,
		   COUNT(number_of_assignees) * 100. / (
   	SELECT COUNT(DISTINCT conversation_id)
   	  FROM intercom_conversations_parts
  	 WHERE author_type = 'admin') AS Percentage
  	  FROM (
    SELECT COUNT(DISTINCT author_id) AS number_of_assignees,
	   	   conversation_id
	  FROM intercom_conversations_parts
	 WHERE author_type = 'admin'
	 GROUP BY conversation_id) assignees_nums
     GROUP BY number_of_assignees
	 ORDER BY COUNT(number_of_assignees) DESC
Using a bar or pie chart is a quick way to visualize the number of representatives needed for each conversation.
Tracking customer service efficacy
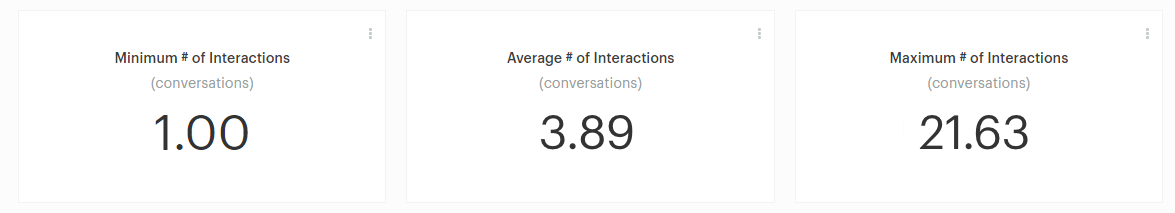
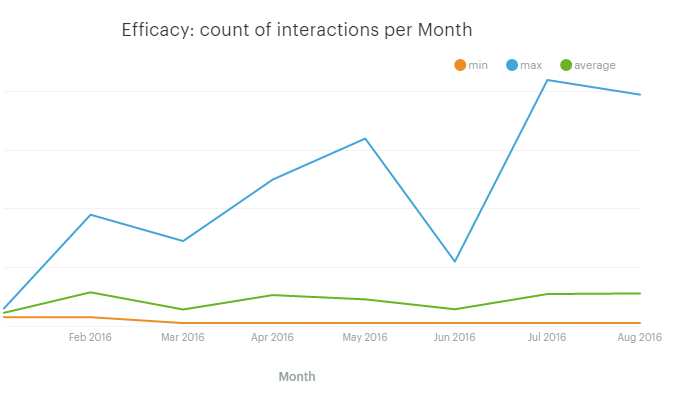
In addition to tracking the resources required for good customer service, we need to track how effective we are—this is efficacy. We decided to track the number of messages exchanged to resolve a problem. Joel refers to this as the count of interactions. In our case, we calculated some basic statistics for the number of messages representatives exchange with customers.
The following SQL query will give us the min, max, and average number of messages exchanged from the moment a new conversation was opened until it closed.
SELECT min(total_messages) AS MIN,
	   max(total_messages) AS MAX,
	   avg(total_messages) AS average
  FROM (
SELECT conversation_id,
	   COUNT(id) AS total_messages
  FROM intercom_conversations_parts
 GROUP BY conversation_id
 ORDER BY total_messages DESC) messages_metrics
Add these statistics to your dashboard and get a quick view like the following.
 The first response time is also important to track. First response time is how long it takes from the moment a customer sends a message until one of our representatives responds for the first time.
The following SQL query calculates the median time it takes for our team to respond to a new conversation.
	WITH tickets AS (
  SELECT id,
  		 created_at
	FROM intercom_conversations
   WHERE created_at > CURRENT_TIMESTAMP - interval '28 days'
     AND conversation_message_author_type != 'admin'),
	 	 parts AS (
  SELECT conversation_id,
  		 created_at
	FROM intercom_conversations_parts
   WHERE part_type = 'comment'
     AND author_type = 'admin'),
	 	 min_resp_times AS (
  SELECT min(parts.created_at) AS first_response,
  		 conversation_id
	FROM tickets
	JOIN parts ON (tickets.id = parts.conversation_id)
   GROUP BY parts.conversation_id)
  SELECT median(extract(epoch
	FROM first_response - created_at)/60) AS median
	FROM min_resp_times
	JOIN tickets ON (tickets.id = min_resp_times.conversation_id)
Unfortunately, the median function is not implemented in most of databases like PostgreSQL and MySQL. You can either implement the function for the database of your choice or use Mode Python Notebooks.
Tracking customer service quality
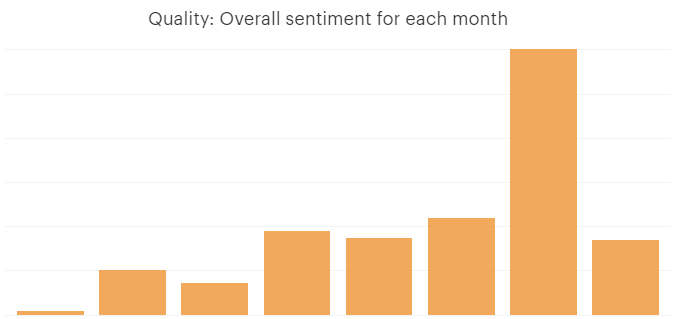
Joel suggests using a Customer Satisfaction Survey (CSAT) or Net Promoter Score (NPS) to track quality. Instead, we’re going to do a sentiment analysis of a customer’s messages to see if they’re satisfied or not.
How to effectively conduct sentiment analysis is beyond the scope of this post. For now, let’s focus on the two main methods we can use:
- Rely on natural language processing (NLP) and statistical learning to create a model that will generate the sentiment of a piece of text.
- Use a service that exposes an API that will perform sentiment analysis to pieces of text that we provide to it. In this case, no knowledge of statistics and NLP is needed.
Each method has its pros and cons, but the important thing to know is that experimenting with sentiment analysis is quite easy. Our goal is to enhance the Intercom conversations table with sentiment information.
When we pulled new conversation data out of Intercom, we made a request to the service that performed the sentiment analysis, and then we enhanced our data with the response of that service.
There’s a large number of sentiment analysis services out there and each one will return a slightly different response. But in every case, the result should be a number in the range [-1,1] where -1 indicates a totally negative sentiment while +1 indicates a totally positive one.
Once a sentiment value is added to each conversation, it’s trivial to calculate our quality indicators.
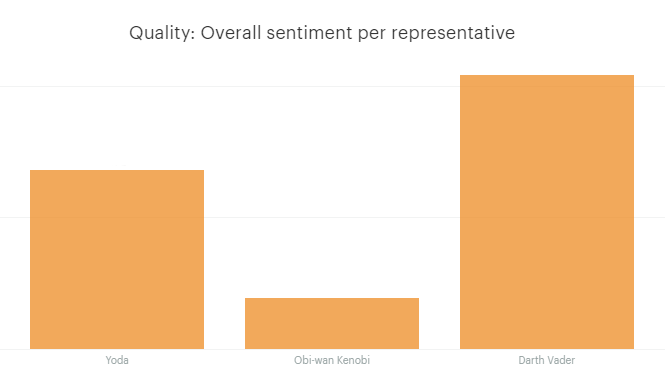
For example, if the sentiment value is in the sentiment column for each conversation part, then a SQL query to calculate the overall sentiment per representative would be:
	WITH assignee_names AS (
  SELECT id,
  		 name
	FROM intercom_admins
   WHERE name <> 'Blendo')
  SELECT assignee_names.name AS Name, count(distinct intercom_conversations_parts.id) AS total_messages, sum(sentiment) AS total_sentiment
    FROM intercom_conversations_parts
	JOIN assignee_names ON (author_id = assignee_names.id)
   WHERE author_type = 'admin'
   GROUP BY assignee_names.name
   ORDER BY total_messages DESC
Taking it a bit further in time and dimensions
So far we have presented a number of metrics we can use to track the dimensions of the Customer Service Cube. In order to make these metrics more effective we need to track them relative to a specific dimension like:
- Time. Aggregating metrics to see efficiency change over time.
- Representative. Calculating each metric for every representative.
- Custom dimension. Identifying the type of problem we are solving or the segment of the customer.
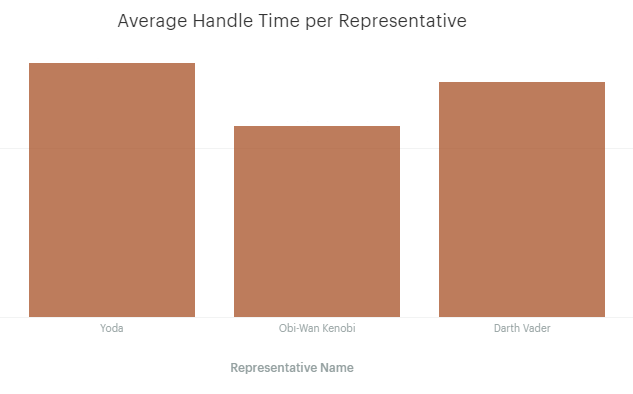
The following SQL query allows us to calculate the min, max, and average resolution time for each of our representatives.
	WITH durations AS (
  SELECT assignee_id,
  		 EXTRACT(epoch
	FROM updated_at - created_at) / (60*60) AS duration_to_solution
	FROM intercom_conversations
   WHERE OPEN = FALSE),
         assignee_names AS (
  SELECT id,
         name
	FROM intercom_admins where name <> 'Blendo')
  SELECT name,
   		 min(duration_to_solution) AS MIN,
		 max(duration_to_solution) AS MAX,
		 avg(duration_to_solution) AS average
	FROM durations
	JOIN assignee_names ON (durations.assignee_id = assignee_names.id)
   GROUP BY name
Let’s see some more! After we select the metrics we want to track, the final step is to create a dashboard and some reports in Mode to keep our eyes on them.
Efficiency
Average, min, and max handling time on a monthly basis
SELECT month,
	   min(duration_to_solution) as MIN,
	   max(duration_to_solution) AS MAX,
	   avg(duration_to_solution) AS average
  FROM (
SELECT EXTRACT(epoch
  FROM updated_at - created_at) / (60*60) AS duration_to_solution, date_trunc('month', created_at) AS month
  FROM intercom_conversations
 WHERE OPEN = FALSE) duration
 GROUP BY month
Total customers per representative
	WITH assignee_names AS (
  SELECT id,
  		 name
	FROM intercom_admins
   WHERE name <> 'Blendo')
  SELECT name AS Name,
  		 COUNT(distinct user_id) AS "count"
	FROM intercom_conversations
	JOIN assignee_names ON (assignee_id = assignee_names.id)
   GROUP BY name
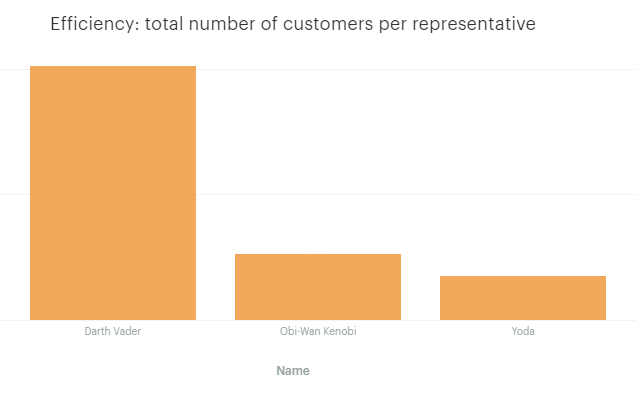
It looks like our representative, Darth, is really customer-focused.
Representatives involved in each conversation by month
	WITH assignees as (
  SELECT COUNT(DISTINCT author_id) AS number_of_assignees,
  		 conversation_id,
		 DATE_TRUNC('month', created_at) AS month
	FROM intercom_conversations_parts
   WHERE author_type = 'admin'
   GROUP BY conversation_id, month),
   		 totals as (
  SELECT COUNT(DISTINCT conversation_id),
         DATE_TRUNC('month', created_at) as months
	FROM intercom_conversations_parts
   WHERE author_type = 'admin'
   GROUP BY months),
   		 frequencies as (
  SELECT month,
  		 number_of_assignees,
		 COUNT(number_of_assignees) as total
	FROM assignees
GROUP BY month,
		 number_of_assignees order by month)
  SELECT month,
  		 number_of_assignees as representatives,
		 total as frequency,
		 total * 100. / count as percentage
	FROM frequencies
	JOIN totals ON frequencies.month = totals.months
Efficacy
Interactions per month
SELECT DISTINCT month,
	   min(total_messages) over (partition by month) AS MIN,
	   max(total_messages) over (partition by month) AS MAX,
	   avg(total_messages) over (partition by month) AS average
  FROM (
SELECT conversation_id,
	   COUNT(id) AS total_messages,
	   DATE_TRUNC('month', created_at) AS month
  FROM intercom_conversations_parts
 GROUP BY conversation_id, month) messages_metrics
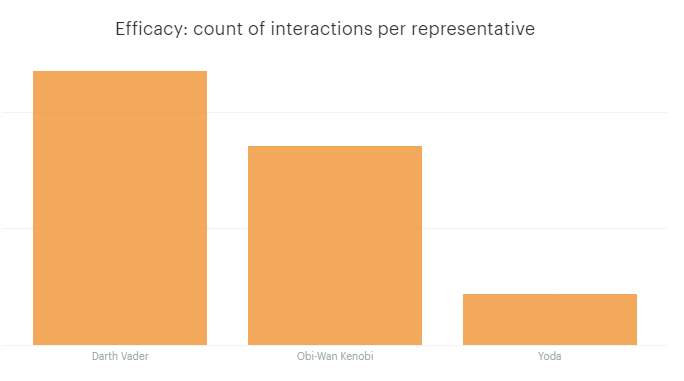
Interactions per representative
	WITH assignee_names AS (
  SELECT id,
  		 name
	FROM intercom_admins
   WHERE name <> 'Blendo')
  SELECT assignee_names.name AS Name,
  		 COUNT(distinct intercom_conversations_parts.id) AS total_messages
	FROM intercom_conversations_parts
	JOIN assignee_names ON (author_id = assignee_names.id)
   WHERE author_type = 'admin'
   GROUP BY assignee_names.name
   ORDER BY total_messages DESC
Quality
Overall sentiment by month
SELECT DATE_TRUNC('month', created_at) AS month,
	   COUNT(DISTINCT intercom_conversations_parts.id) AS total_messages,
	   SUM(sentiment) AS total_sentiment
  FROM intercom_conversations_parts
 WHERE author_type = 'admin'
 GROUP BY month
 ORDER BY month
Difficult in Intercom, easy in Mode
Intercom and other services offer immense value. But their valuable data is locked away in disparate places. If you have that data in its raw form in a central place, you can take your customer success to a whole other level. Combining data from multiple sources often reveals valuable information that you couldn't see initially.
Ready to unlock your customer service data?
Consolidate your data into Redshift with Blendo, connect Redshift to Mode, and use the queries above on your Intercom data. Compile the results in a report—or two, or three!—and share the findings with the rest of your team.

