Sometimes you just need to share a data set. A list of app users who meet certain criteria. A call list for a sales team. You get the idea. Often the next step with shared data sets like these is for someone to export the data as a CSV to do simple explorations in Excel.
The export step breaks the connection between the data and the query—and is a hassle if all you want to do is a quick filter to find some specific values or look at a subset of the data.
We've just updated report tables to provide more exploratory power right in Mode. You'll also find more formatting options to help you better communicate the details of the data set.
Format numbers
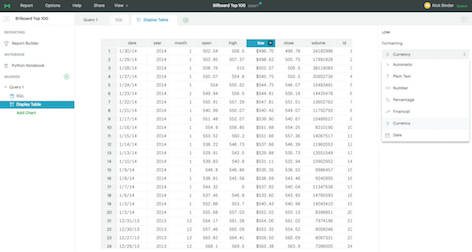
Use the new formatting panel to make a data set more easily digestible. After running your query, click into the Display Table tab. Just like in the chart builder, you'll find formatting options on the right side of your screen. Pick and choose columns to present, and set formatting on a column-by-column basis. In addition to date and decimal formatting, you'll find new options for currency and percentile formatting.
Highlight the column you wish to format by clicking on the header. Then choose how you'd like to see the data presented from the drop down.
In this example using a dataset that looks at a sales team's performance, you can format their sales figures as currency and their performance relative to their targets as a percentage, making it easier to quickly understand:

Column sorting
Once your data table is formatted, share it. The recipient can quickly sort results by clicking on a column header. Going back to our sales example, you can sort performance by total sales, or by performance against sales targets:

Quickly filter results
Once you're viewing the table in a report, you can filter the table down to find specific data points. With this added functionality, you can provide a larger data set to the recipient and let them filter and explore data on their own.
Just use the new filter bar at the top right of each table to quickly narrow the data down. Try it out on the embedded table of Billboard Top 100 songs from the past 50 years to see if you can find your favorite band:
Empower report viewers, free up analysts
With these updates to Mode's tables, report viewers can explore a data set with quick sorts and filters—without querying or exporting. When combined with other reporting features in Mode, like scheduled email sharing or report parameters, your business partners can make informed decisions more quickly and you can free up time to dive into other analyses.
Questions? Feel free to reach out to Mode via the chat icon right in the product. If you haven't signed up for a Mode account yet, sign up and get started with a free trial today!


