


As your business grows, maintaining excellent customer service requires delivering high-quality solutions efficiently and effectively. But balancing the goals that lead to great customer service is a challenge—overemphasize efficiency and your quality may suffer; provide a white-glove experience on every interaction and your customer service cost might bankrupt the entire company.
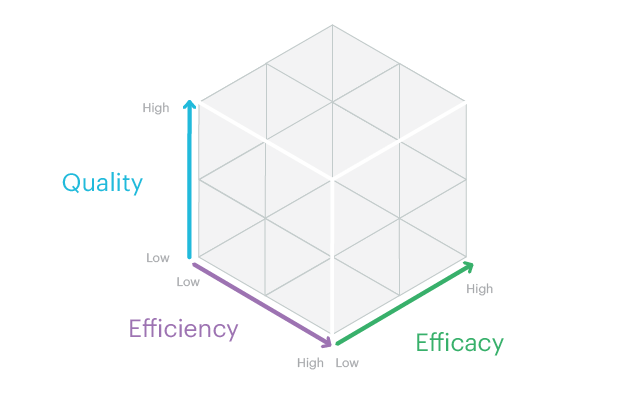
Achieving great customer service at scale requires optimizing across a set of goals, not just one. I think about results in terms of a cube where each axis represents one of three key goals— efficiency, efficacy, and quality. Today, we'll cover why these goals are important and how you can measure them, illustrate how they converge to form a customer service cube, and demonstrate how to use your own data to explore these relationships at your company.
Defining customer service goals
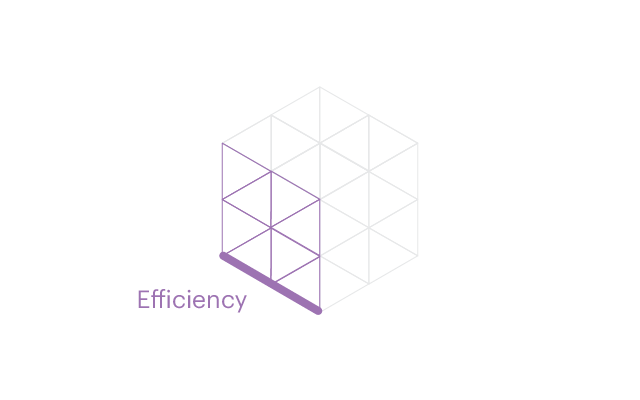
Efficiency is the first dimension of the customer service cube. Efficient customer service teams minimize the amount of time it takes to solve a customer's problem. I've found handle time, the total time a representative spends solving an issue, to be the best measure of efficiency.
Minimizing handle time is important for two main reasons:
- A customer's time is valuable. By contacting customer service, your customers are taking time out of their day. The more time it takes a representative to resolve the issue, the more hassle for the customer.
- A representative's time is expensive. Labor is the largest cost driver in a customer service organization. Cutting down the amount of time a representative spends on each issue creates a cost effective organization and frees up resources to invest in other parts of your business.
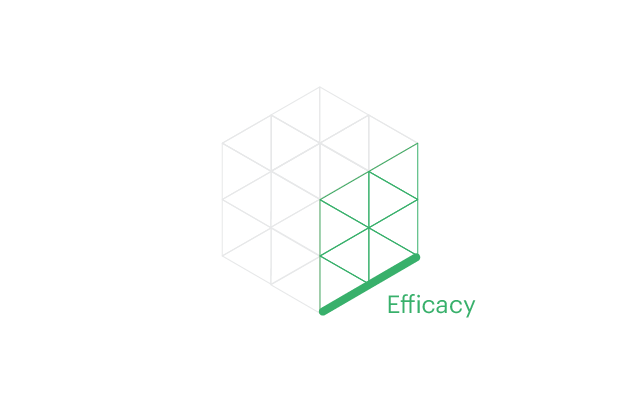
With efficacy, you're looking to evaluate the success of a representative's solutions. You can measure efficacy through the count of interactions required to solve a customer's issue.
Minimizing the number of interactions is important because offering ineffective solutions will lose customer trust. Customers have faith in you to understand their problem and fix it. Don't let them down! Nothing is more frustrating than feeling unheard or misunderstood, and when a representative offers an unhelpful or irrelevant response, a customer might begin to question the company's credibility.

Maximizing customer service quality, or how the customer feels about their experience, is important for maintaining customer loyalty. Let's face it, nobody looks forward to contacting customer service. How you handle the situation shapes your relationship with customers.
Demonstrate compassion, friendliness, and maybe even some good-natured humor, and you might turn an otherwise negative experience into something joyful. Treat your customers coldly, and they might turn on you.
Unlike efficiency and efficacy, which can be broken down into objective measures, quality is subjective and more challenging to gauge. You can best measure quality with a statistically robust customer survey where you minimize response bias. Typically a Customer Satisfaction (CSAT) survey is used to measure immediate satisfaction with a recent customer service interaction, whereas a Net Promoter Score (NPS) survey is used to measure overall, long-term customer happiness. Both are highly valuable, but CSAT is typically used with the customer service cube as it's associated with a specific customer service experience.
CSAT surveys take a variety of forms and feature a range of scales. To choose the one that's best for your business, do some controlled multivariate testing and select the survey methodology that's most predictive of the business outcomes you care about.
Bringing goals together in a customer service cube
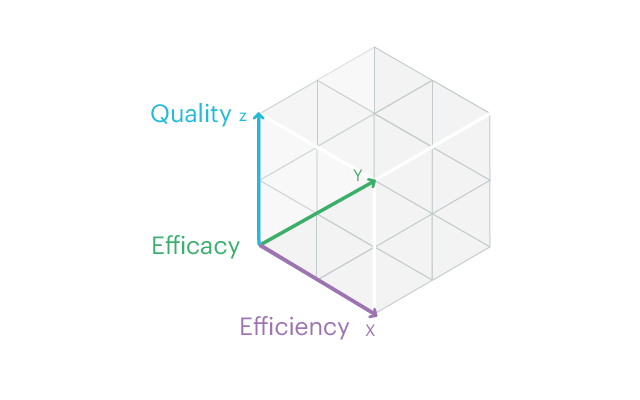
Rather than focusing on each goal in isolation, the customer service cube provides a framework for thinking about outcomes holistically. To conceptualize the cube, start by associating each goal with one of three axes where:
- x = efficiency
- y = efficacy
- z = quality
These axes are the foundation of the customer service cube.
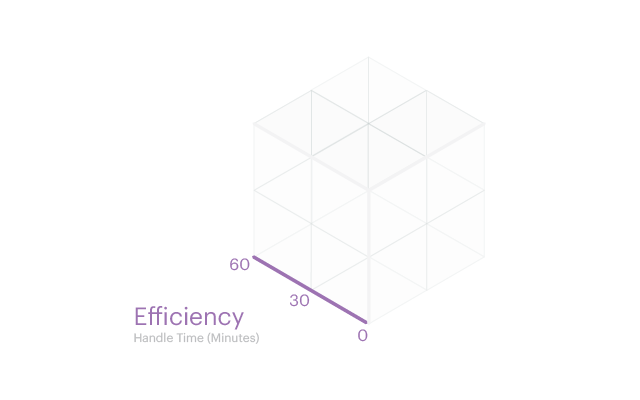
Now it's time to add scales to each axis. For efficiency (x-axis), you can set the scale from 0 to the highest handle time you might expect. Keep in mind that high efficiency means low handle time (and vice-versa), so a handle time of 0 minutes represents the maximum on your efficiency scale. For this example, you can assume handle time is never greater than 60 minutes, and set a handle time of 60 minutes as the efficiency minimum.
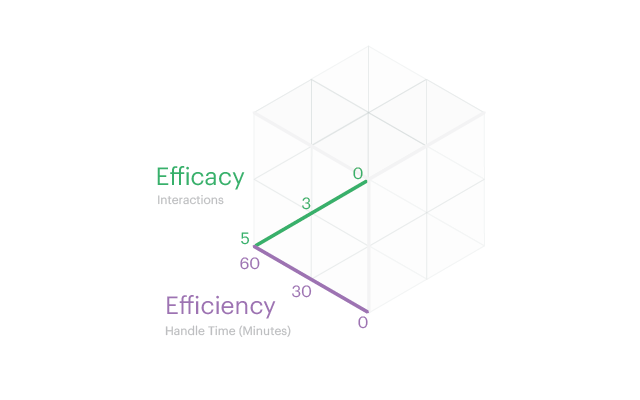
Onto the efficacy axis (y)! Here, you can set the scale from 0 to the most interactions you might expect (5). High efficacy means low interactions, so you can use 0 interactions as the maximum and five interactions as the minimum.
Again, lower is better. A lower number of interactions represents a higher efficacy.
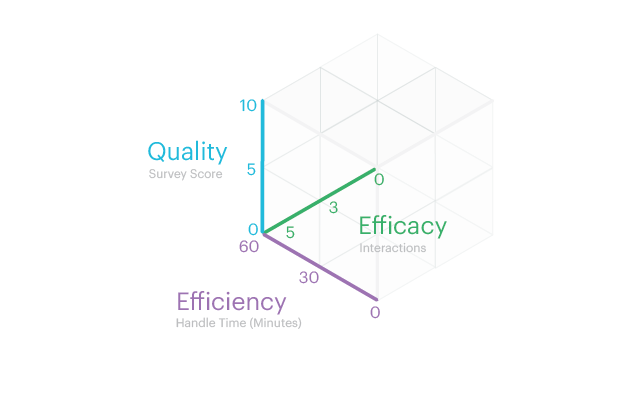
Finally add the z-axis, quality, for which the scale will correspond to that of the survey you're using. For this example, assume that your CSAT survey is on a 0-10 scale.
The goal of quality has a positive relationship with its metric (survey score), so a higher number represents higher quality.
Plotting customer service outcomes in 3D
This cube is more than a mental model for conceptualizing customer service goals. With the help of 3D-plotting, it becomes an interactive, explorable chart that reveals practical insights. Since Mode recently added support for Plotly, I was able to plot customer service metrics in our Python Notebooks.
The customer service cube is general enough to apply across a wide range of modalities (channels through which people receive customer service) including phone, email, live-chat, and in-person support. The data you're using will vary widely depending on the customer service modality and tools you use, and you may need to implement some additional upstream processes to ensure you're tracking handle time, interactions, and quality scores. Once you're capturing the data, you'll be all set to start plotting it in 3D.
Customer service over time
Perhaps you want to understand daily customer service trends for the entire company over a couple weeks' time. Start by taking daily averages for handle time, interactions, and quality scores for a period of 14 days. It's important to work with aggregated data, such as a daily average, as not all interactions will receive a quality score.
Once you have these data points, you can plot them in 3D.
Click and drag your mouse to rotate the plot. Scroll to zoom in and out. To see the complete Python notebook generating this plot, click here.
This plot reveals a trend of improving efficiency and decreasing quality. Efficacy, however, has remained constant. The drop in quality is likely due to something other than a failure of representatives to offer appropriate solutions. Since you know efficiency is increasing, you could hypothesize that while representatives are still effectively problem-solving, they may have stopped providing the personalized care and soft-skills that customers appreciate.
Customer service by issue type
You might also be interested in evaluating performance for different types of customer service issues. Maybe you have a few buckets of common issue types including Signup, Tech, and Security that you want to compare. You can group by issue type to get a sense of the outcomes for each.
To see the complete Python notebook generating this plot, click here.
Signup appears to be an issue you handle quite well, producing favorable outcomes in all three areas. You look to be lacking in both efficiency and efficacy for Security issues, but you manage to maintain a high quality for those interactions nonetheless. Tech issues, on the other hand, appear to be handled poorly across the board, and likely represent an area requiring improved resources and training.
Customer service by representative
Say you're managing a team of customer service representatives and you're interested in evaluating your team's performance. You can group by representative to reveal the relative strengths and weaknesses for people on your team.
To see the complete Python notebook generating this plot, click here.
Exploring the results, you might recognize that Jerry consistently has the highest quality and his efficacy is also very strong, but he's less efficient than some of his teammates. You might be able to work with Jerry to identify some time-saving techniques to improve his efficiency without sacrificing quality or efficacy.
Elaine, on the other hand, has very strong efficiency and efficacy, but less-than-stellar quality. Maybe she and Jerry can exchange best practices to help each other improve.
George struggles with efficacy but his efficiency isn't bad. Perhaps he's rushing and could benefit from taking a bit more time with each interaction to prevent customers from needing to continually follow-up.
Kramer is the most volatile and needs to improve in terms of his overall consistency. Some days he has excellent results— help him identify what he's doing differently on those days.
From concepts to concrete insights
Efficiency, efficacy, and quality are all vital goals for a successful customer service team. Optimizing one goal at the expense of others can lead to lopsided outcomes that may negatively impact your business, so it's important to take all three into account.
Over time, you might make tradeoffs in terms of how you choose to prioritize these three goals. In an early stage of your business, you might prioritize quality over other goals to cultivate brand evangelists that will help you grow. As you get bigger, you may decide to place more emphasis on efficiency for cost implications. You can use the customer service cube to chart your course through these cycles.
The customer service cube offers both a conceptual framework for thinking about results holistically as well as a practical way to measure performance. Unlike traditional two-axes charts, 3D-plotting captures all three goals in an interactive, exploratory environment where trends really pop off the grid.
Explore different ways to make your data interactive with Plotly in Mode. Sign up for a Mode account and take Plotly for a spin!

