How to Switch from Excel to SQL
Melissa Bierly, Content Marketing
December 10, 2021
NaN minute read
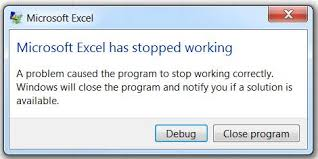
If you use Excel at work, you're probably frustratingly familiar with this dialog box:
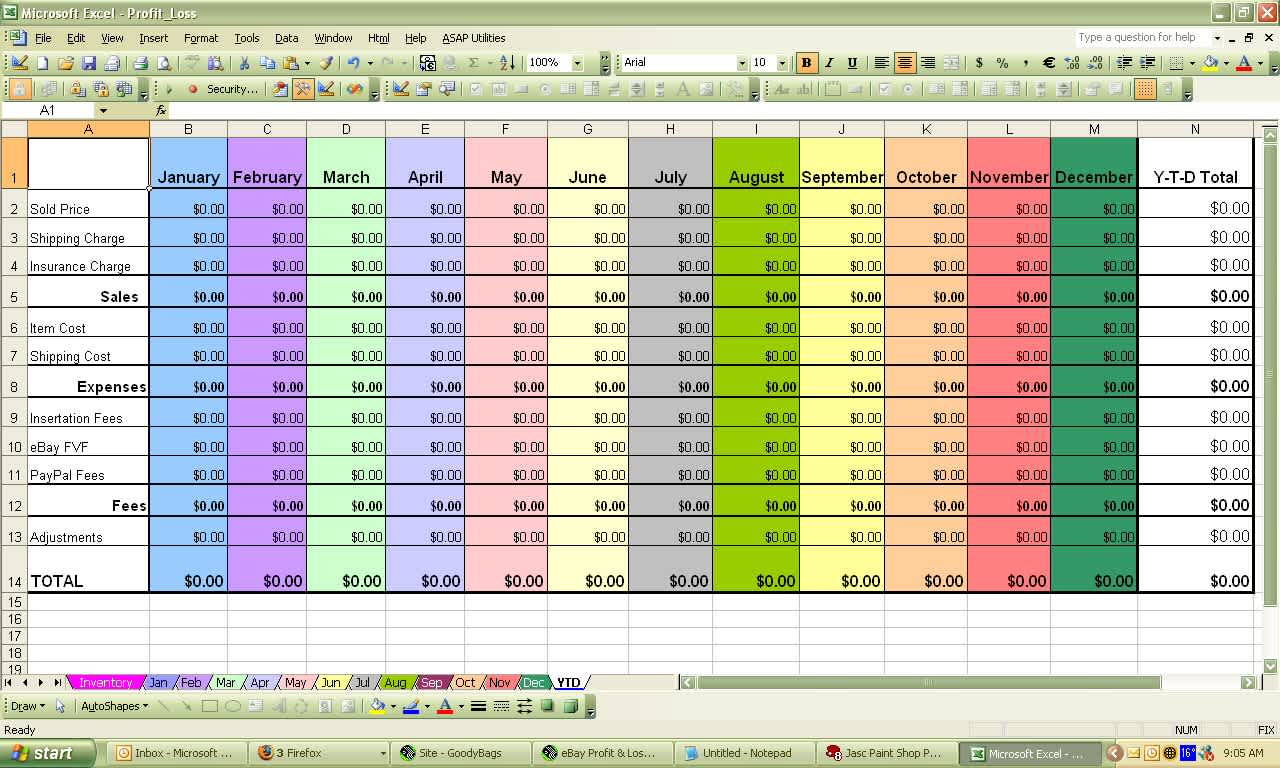
You've probably also worked on a spreadsheet that was painfully slow to edit, where every click was accompanied by 10 seconds of your screen freezing and the spinning wheel of death.
Usually, large files or workbooks full of formulas are to blame. Excel can handle up to a million rows, but when you're working with a large dataset or doing heavy duty analysis—applying formulas to a bunch of cells, linking multiple spreadsheets, or connecting to other workbooks—it slows down way before you hit the row limit.
Excel has another weakness that can lead to inefficiency: its structure is too flexible. That might sound kind of counter-intuitive—flexibility is one of the reasons people love Excel. Since each cell is its own entity, you have a lot of freedom to add footnotes, merge cells together, or plot out a needlepoint pattern.
However, if one cell can be manipulated easily, it's harder to trust the integrity of the spreadsheet as a whole. Excel's flexibility makes enforcing consistency and accuracy in large datasets nearly impossible. No matter how vigilant you are, no matter how many times you comb through a spreadsheet for typos and broken formulas, you might still miss something.
There's often a better tool for the job.
Bonus: Harness your Excel knowledge to learn SQL with these quick tips and tricks. Download our free workbook to learn how to translate go-to Excel functions into SQL.
Benefits of Switching from Excel to SQL
The data you're working with in Excel had to come from somewhere. That somewhere is a database. Even when you pull data from something that doesn't feel technical (think Google Analytics, Stripe, or Salesforce), behind the scenes you're querying a database.
How many web visits did we get in January? What's our payment funnel abandonment rate for the product we just launched? Which sales reps are building more pipeline than others? These are all queries, in "human," not "computer," speak. As an Excel power user, you can probably think of how you might write these questions as formulas if armed with the right dataset.
So how do you directly query a database instead? In most cases, people use SQL (short for Structured Query Language). SQL tells a database what data you want to view and manipulate with calculations.
By moving some of your initial calculations to SQL, you can pare down the amount of data you export. And with a smaller dataset, you're less likely to run into Excel performance issues.
As you get more comfortable with SQL, you can move more and more of your analysis into SQL until you reach the point where Excel becomes the exception, not the rule. SQL databases can handle enormous amounts of data without suffering performance issues and have an orderly structure that protects the integrity of your data.
Learning a new language might sound daunting—as can using tools that simply feel more technical. But as an Excel user, you already know more about SQL than you might expect.
Spreadsheet, meet relational database
A database is an organized collection of data. There are many different kinds of databases, but the specific type of database SQL can communicate with is known as a relational database.
Just as an Excel workbook is composed of spreadsheets, a relational database is composed of tables, like the one below.
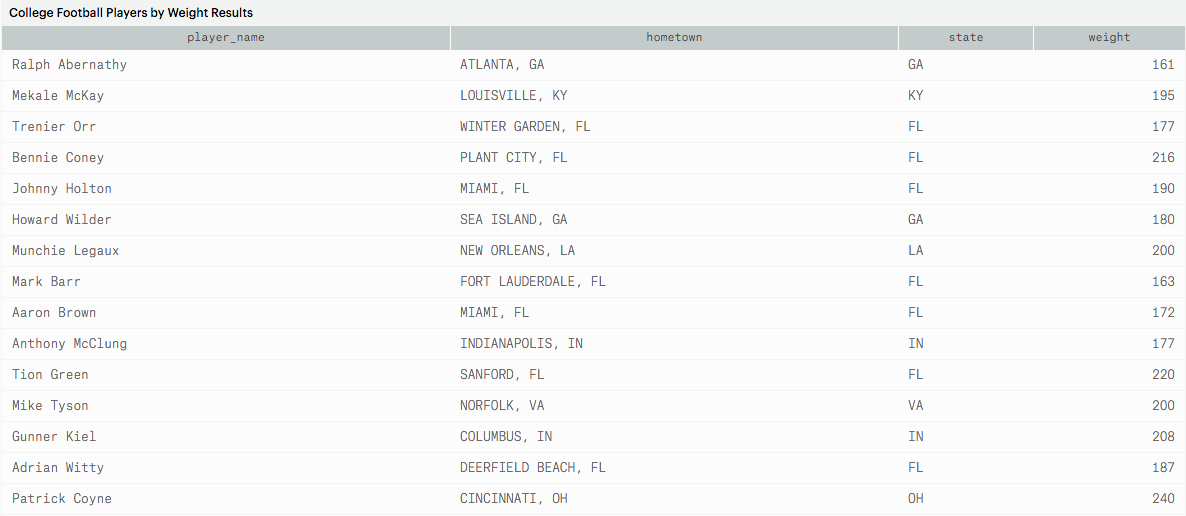
Tables have rows and columns just like a spreadsheet, but in a table, you can't interact with each cell (or “value,” in database terminology) individually. If you want to exclude Ralph Abernathy's hometown from the top row in the table above, you can't just delete it. You have to exclude the entire row or the entire “hometown” column.
The reason you can't change cells on the fly is because a database has a rigid structure. The values in each row are tied together as a single unit. Each column must have a unique name and can only contain a specific type of data ('Integer', 'Text', 'Date', etc).
Excel's flexible structure might sound pretty good right now, but hang on. Because a database's structure is so strict, it's easier to protect your data's integrity. In other words, it's much less likely that you'll end up with inconsistencies and errors. And that means you can place a lot more trust in your data.
From Excel formulas to SQL queries
The most common way to manipulate data in Excel is by using formulas. A formula consists of one or more functions that tell Excel what to do with the data in a cell. For instance, you can add numerical values together using SUM(A1:A5) or average them using AVERAGE(A1:A5).
The SQL equivalent of a formula is a query. The query to return the table above looks like this:
SELECT player_name,
       hometown,
       state,
       weight
  FROM benn.college_football_players
SELECT and FROM are the two fundamental ingredients of any SQL query: SELECT specifies the columns of data you want and FROM indicates which table they live in. You can actually choose to display all the columns by adding an asterisk (*) after SELECT, like this:
SELECT *
  FROM benn.college_football_players
This query would show you all the columns in the benn.college_football_players table, so you can get an idea of what the entire dataset looks like. Once you know what you need, you can quickly cut the columns to reduce the size of the dataset.
Like formulas, queries are composed of functions that specify data manipulations. Queries can also contain clauses, operators, expressions, and a few other components, but we're not going to go into the details here. What you need to know is that you can use SQL to manipulate data in pretty much any way you do in Excel.
Take the IF function, for instance. You use IF to create conditional statements that filter data or add new data based on rules you define. Here's what an IF function looks like when you apply it to a cell:
=IF(logical_test, value_if_true, [value_if_false])
You could read that as IF <some condition is met> THEN <display this value> OTHERWISE <display a different value>. The OTHERWISE portion, which is shown as [value_if_false], is optional.
The SQL equivalent of IF is CASE. They have very similar syntax:
CASE WHEN <condition 1 is met> THEN <display value 1>
     ELSE <display a different value>
     END
CASE statements are considerably easier to read than IF statements because SQL queries have multiple lines. This structure is ideal for an IF statement with multiple conditions. For instance, if you want to add two categories based on existing data in Excel, you have to nest one IF statement inside another IF statement. When you add a lot of conditions, things get ugly quickly. But in SQL, you can just add a new condition as another line.
In SQL, let's add multiple conditions using the college football data from above. We're going to add a column that divides the football players into four weight groups. Here's the query:
SELECT player_name,
       weight,
       CASE WHEN weight > 250 THEN 'over 250'
            WHEN weight > 200 THEN '201-250'
            WHEN weight > 175 THEN '176-200'
            ELSE '175 or under' END AS weight_group
  FROM benn.college_football_players
And here's what the results table looks like:
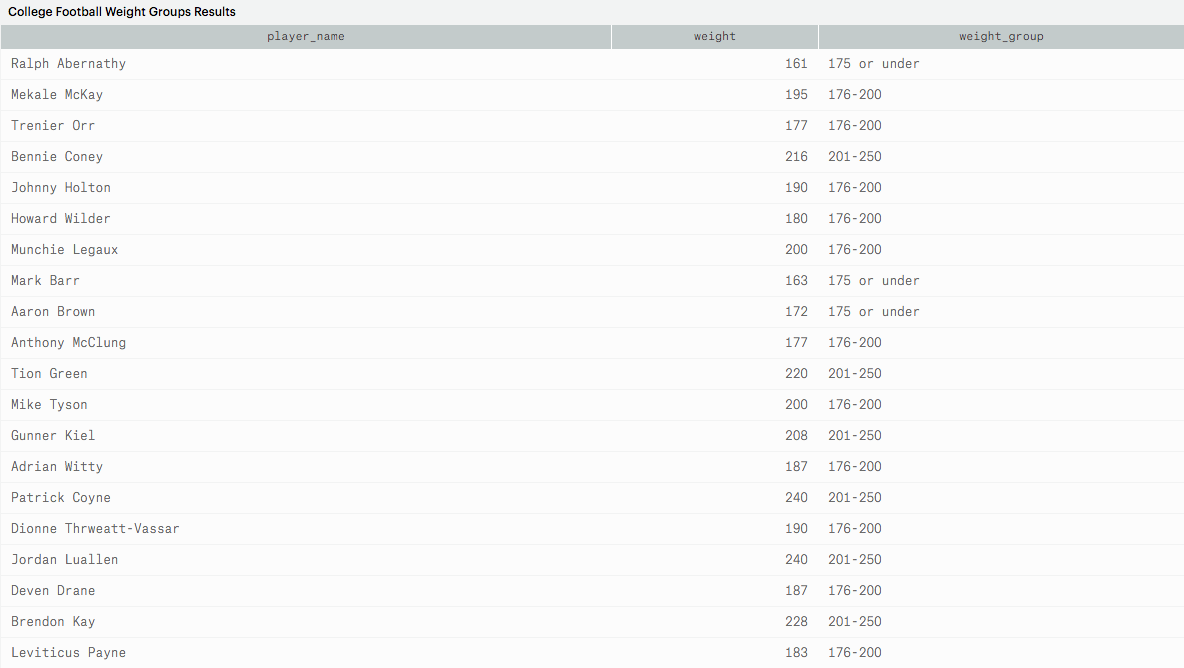
Not too hard, right? The IF statement for this would be a nightmare.
You might be thinking, but what about charts and graphs? What about the graphics that make my report a report? One option is to manipulate data in SQL, export it, and build charts in Excel.
If you want to skip the export step, though, some SQL programs (like Mode) allow you to build charts on top of your query results. These charts are tied directly to your database, so anytime you rerun a query, your results and visualizations automatically refresh.
Next steps for learning SQL
As you gain SQL knowledge, it's helpful to know where to focus your learning and how to navigate your company's data.
Pick tutorials geared toward data analysis
There are a lot of SQL resources, but not all of them are focused on data analysis.Engineers and database administrators use SQL to create, update, and delete tables in databases. They can upload a whole new table or delete one permanently from the database. These are very different tasks from how you'll use SQL (at least until you fall so in love with data that you make a career switch to analytics).Don't get bogged down in SQL tutorials that are designed for database management. Hone in on query-focused tutorials. Here are some SQL lessons to start out with:
If you find yourself in tutorials talking about things like:
CREATE TABLEDROP TABLECREATE DATABASEDROP DATABASE
...you've gone down the wrong rabbit hole.
Practice with your company's data
If you're doing analysis at work, there's really no substitute for using your company's data to learn SQL. You can explore your company's data structure and learn technical concepts at the same time. Whatever you pick up will be immediately applicable to your job.
To do that, you need to understand how your company's data is organized. Where's the product and marketing data stored? If you want to look at the accounts that churned last month, which table(s) should you be querying? Most businesses have an analytics team that works with your company's data on a daily basis. These folks will be able to answer your questions or point you to helpful documentation. There's a mutually beneficial relationship here: if you're querying data on your own, you're reducing the analytics team's backlog of data requests. Guaranteed brownie points.
A number of Mode customers have even set up regular training sessions during which analysts teach colleagues SQL using their internal data. Feedback has been overwhelmingly positive from both groups of folks! Let us know if you're thinking about setting this up at your company. We're happy to share some learnings.
You're on your way!
Champing at the bit to get started? Dive into our SQL Tutorial!
Recommended articles
Get our weekly data newsletter
Work-related distractions for data enthusiasts.


