


Dashboards. They're the best way to keep every team focused on goals and provide critical context for your business as a whole.
While not as exciting as exploratory analysis, building dashboards is a high-impact responsibility for any data team.
Dashboards engage more people in your business with data, and get more people asking the hard questions that lead to game-changing ad hoc analysis. Tightening the cycle between the two deliverables is a massive win for analysts and their companies.
Today we're launching Mode Dashboards, a suite of new features that let you deliver dashboards that knock people's socks off. Teams get the beautiful, interactive reporting they want, you get the workflow you know and love. All in one place.
When you power your dashboards with SQL, everyone wins.
Introducing Mode Dashboards
Today's new features make it easy to quickly get your data presentation-ready, ensuring that your co-workers stay focused on the data. Here's what's new:
Full width
Set your report to full width to show more charts at once.
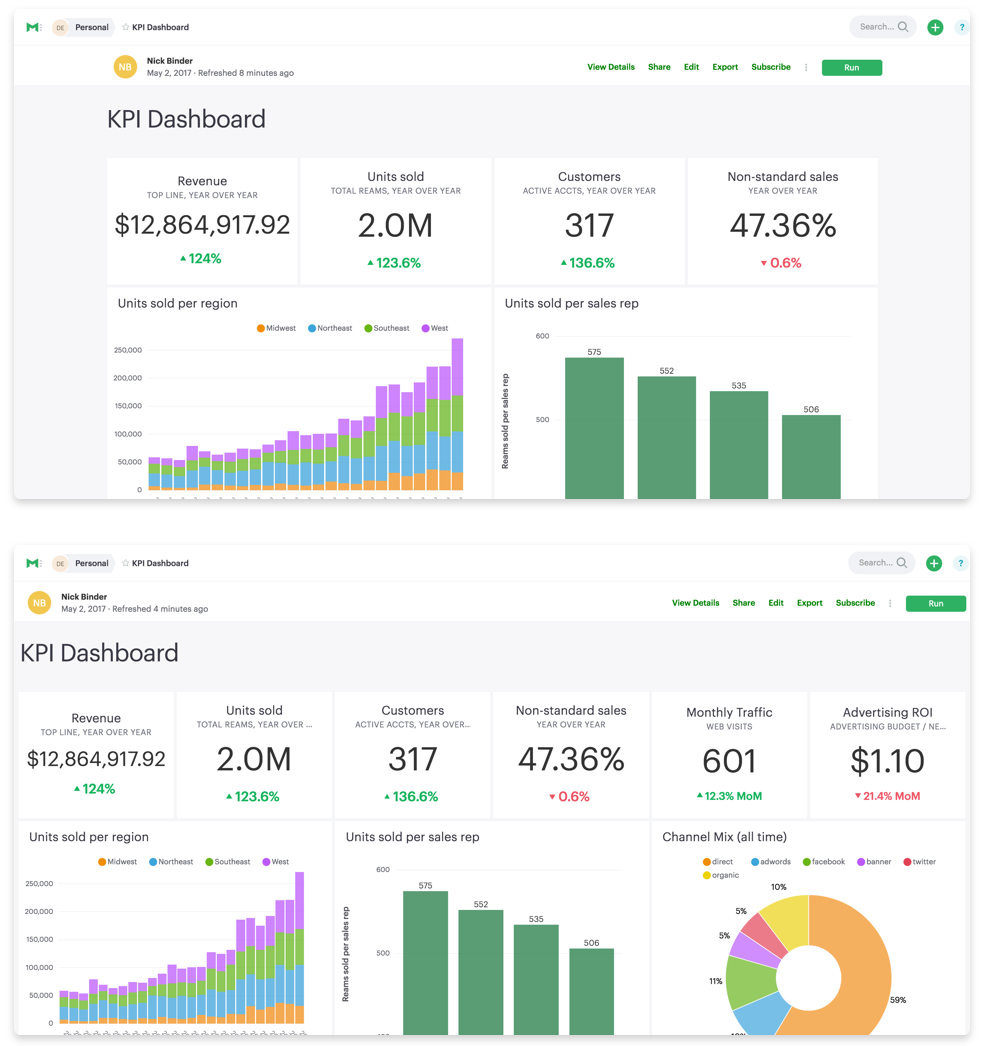
Expanded views
Small charts are great for tracking performance at a glance. Big charts are great for exploration. Expanded views give you the best of both worlds. Open up any chart or pivot table for big-time exploration.
TV-ready
The new full screen button lets you display dashboards on TVs around the office. When in full screen, dashboards automatically refresh when a scheduled run finishes. Combined with granular schedules that update as often as every five minutes, you help teams track performance in real time.
Themes
You know what looks great on TVs? Dark colors. Quickly switch from the standard light theme to the new dark theme.
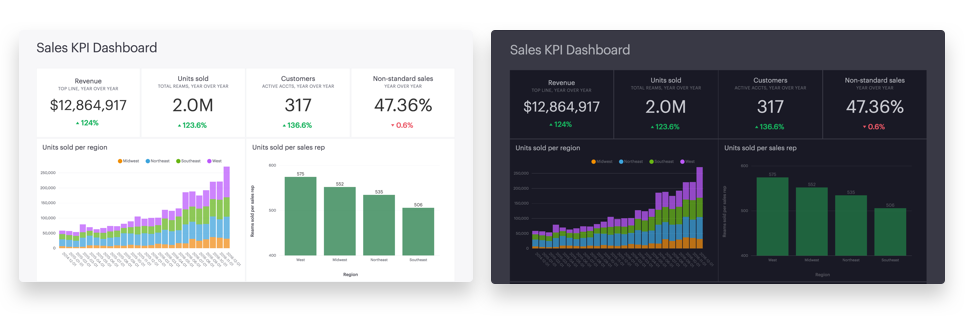
Custom themes
Earn serious style points by delivering on-brand dashboards. Custom themes, available on the Plus Plan, let you control fonts, colors, and styles from one central place. Pick one of your on-brand themes as your organization's default and every Mode report you deliver will look as good as the data itself.
Custom themes aren't just great for dashboards. They also make it super easy to screenshot charts beautiful enough to drop straight into a Keynote or Powerpoint deck for presentations.
“Reports that look and feel like the Everlane brand help internal teams buy in, leading to more informed decisions across the business," says Matt Hogan, Engineer at Everlane. "A well-designed report by default is a win for everyone involved.”
Try out the new features
Head over to the help site for documentation on all the new features, or jump right in to give them a try for yourself.
As with all of our releases, we absolutely love your feedback and questions. Email us at hi@modeanalytics.com or click on the chat icon in the product to talk with our team.

