


When we introduced White-Label Embeds about a year ago, our goal was to give people the ability to deliver data to their communities in a way that feels native to their brands and products.
Analysts and product teams now work together to build in-app User Stats pages with White-Label Embeds. We've used it for this exact purpose in our product, too.
When we kicked off the project, we identified two primary goals; 1)showcase White-Label Embeds in action 2)provide our customers valuable insight into their use of Mode, in a way that would feel on-brand and seamless.
As we started designing and implementing our own stats page, we identified three key jobs the page needed to do to deliver on goal number two. They're things we commonly hear from other folks getting started with embedded analytics, too. In future posts we'll dive into the nuances of building datasets and visualizations that deliver on each of these jobs.
1. Answer universal account questions
As your company grows, customer success becomes a bigger and bigger job. Patterns emerge as customers ask questions about the value they're getting out of your product—and how they can be getting more. Your account management and success teams can help identify the most commonly requested stats, so that you can enable customers to “self-serve” and get the answers to these questions.
By automating the delivery of stats tailored to each customer right in the app, you not only save time for your account and success managers, you also reduce the human error of sending the wrong stats to the wrong people.
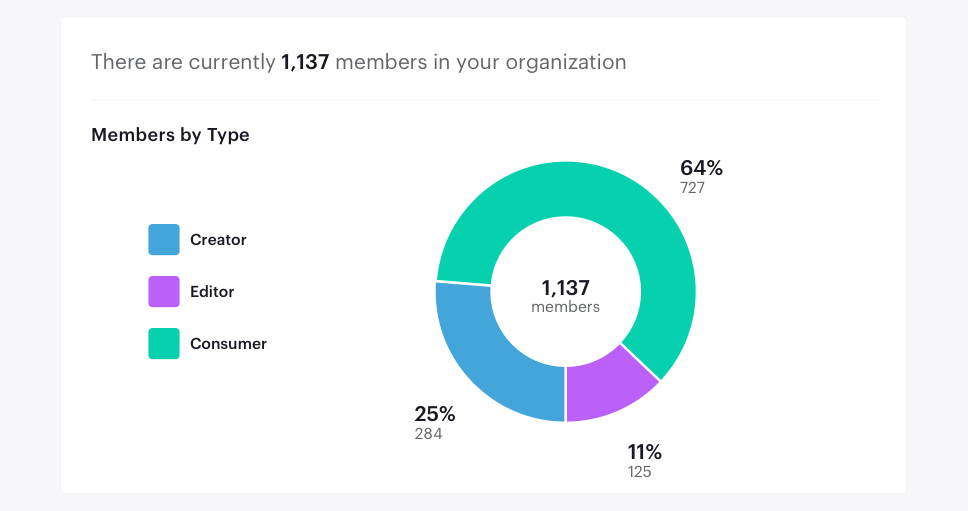
Most of the questions our account managers were getting were about simple usage data. How many people create Mode reports? How many people use reports but don't create them? Which reports are run most often? These questions would come up in nearly every account review, nearly every time. A very simple dashboard can answer all these questions at a glance. We wanted to give our customers access to this data without needing to get on the phone with us. It saves us as much time as it saves them.
2. Highlight underutilized product features
A usage dashboard is an opportunity to introduce customers to aspects of your product that they may not be using to their full potential.
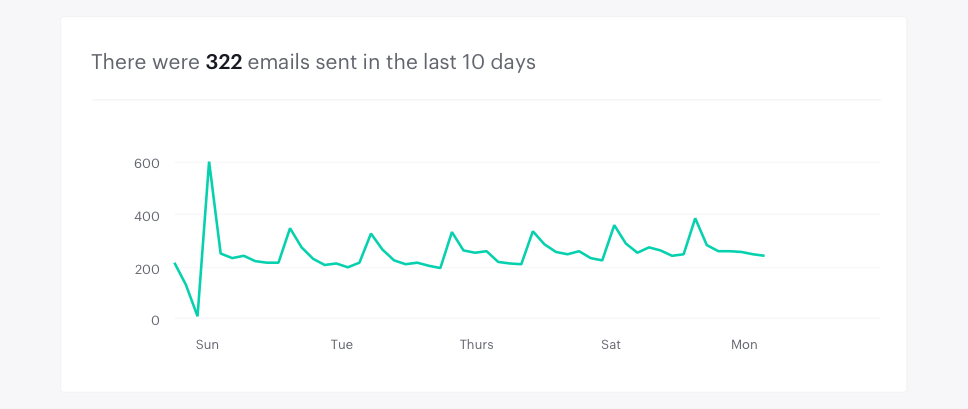
We included stats on features that we know provide value, but that are sometimes overlooked by new customers. For instance, Mode users can share reports through email and Slack, either as a one-off or a scheduled send. One of Mode's great strengths is the delivery of analysis to people outside the data team, so we want users to understand the full variety of ways this can be done.
This is an example of a stat that works well both as a strong trend and a weak trend. If usage is strong, analysts can show how their work is impacting their entire organization. If usage is weak, it's an opportunity for analysts to discover more ways to distribute their work.
3. Help users do their jobs better
A good Stats page should do more than simply offer usage data. Beyond how their organization is using your tool, customers should be able to learn something that helps them do their jobs better.
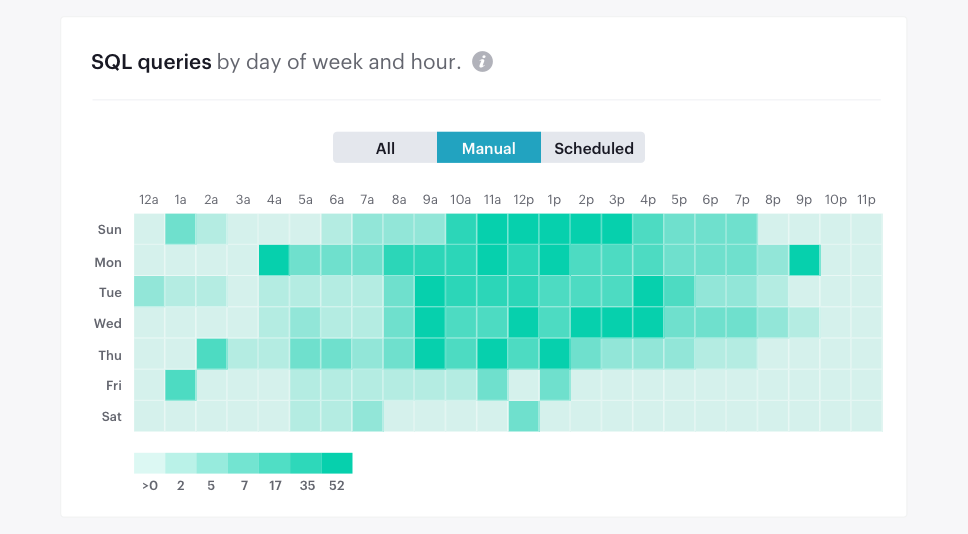
For Mode, this value-add comes in the form of database load management. Many of our customers want to better understand database load so they can spread out report runs, thereby getting quicker results. We built the Stats page to include a heat map of scheduled and ad-hoc query runs by day and hour. When someone finds a particularly saturated time period, they can move scheduled runs to a different time, freeing up the database and getting faster results.
... So We Assembled a Team
To build a page that would achieve these three goals, we assembled a small team including an analyst (me), a designer, and an engineer. It took two weeks. As the analyst on the project, I was able to iterate on the queries and prototype visualizations using Mode's built-in charts, in the same place where I do all of my other analysis. Once we got sign-off from other stakeholders that the queries were returning metrics that we could put in front of customers, we moved the report into a secure, limited space within Mode. This ensures that reports used in our production environment can't be accidentally edited or deleted by coworkers using Mode for their own internal analysis.
With the stock charts built, our designer got to work. Because White-Label Embeds are completely customizable with HTML, all the designer needed to do was make a quick mockup in Sketch to define the styles. He handed that file off to a front-end engineer, who then jumped into the HTML editor in the report builder to add custom CSS.
Once the report was built, we had to do some lightweight development in the Mode app. We needed to designate a page where we'd embed the Mode report, and set up the authenticate to serve the right version of the stats page to the right customers. This part of the project took about a day.
And just like that, our customers could self-serve valuable insights about how their teams were using Mode.
The functionality of White-Label Embeds saved us countless hours of development time. Had we needed to build a delivery mechanism for this data from scratch, it would have taken an entire feature cycle and require a lot of data infrastructure work. Instead, a small team was able to leverage the tools we already had—and our existing data infrastructure—to ship something of value to our customers in less than two weeks.
To learn more about how your team can use White-Label Embeds, schedule some time with our team.

