


Anyone who's used Salesforce is familiar with its reporting dashboard. The deal pipeline, the closed deals speedometer, the reps' activities. As companies mature, these dashboards begin to inspire complex questions that the built-in reporting tool just can't support. Salesforce openly admits their limitations. After all, their primary goal is to help you manage relationships with customers.
To go deeper with CRM analytics, what you really need is (1) one central place to store data from across your business—we're talking Salesforce data, product data, support data, marketing data, the list goes on—and (2) a robust analytics tool to make sense of it all.
You can solve the first problem by consolidating all of your data into a data warehouse. Some companies opt to build their own data pipeline to stream data from multiple sources into a warehouse. This endeavor can suck up a lot of time and resources.
Our chief analyst, Benn Stancil, once worked at a company that built its own pipeline. It took about six months to build a stable pipeline from Salesforce to their central data warehouse, and once it was built, the company had to dedicate a full-time engineer to maintain and slowly upgrade it. In the beginning, there were errors in how the data was moved, causing analysts to distrust the data. Any time the pipeline went down, people were pulled off other projects to fix it. Even though the pipeline was tremendously valuable, it took a massive amount of resources to maintain it.
Thankfully, RJMetrics built Pipeline, which you can use to centralize your data in Amazon Redshift without exhausting your resources. As a data source comes online, you can begin to explore its raw data. And as the second and third come online, you can begin to join information from data sources together to gain an understanding of how different parts of your business influence one another.
Once you have your data in one place, SQL can be one of the fastest and most powerful ways to analyze it. If you're new to SQL, don't be intimidated. It's easy to learn, especially if you have some experience with Excel.
Here, we start simple, exploring some examples that rely on Salesforce data alone. Then we'll dive into a few examples that combine Salesforce data with data from other sources.
From Salesforce to SQL
To demonstrate the ease of making the jump from Salesforce to SQL, let's start with some simple questions:
- How many deals do we close each month?
- How long does it take us to close each of those deals?
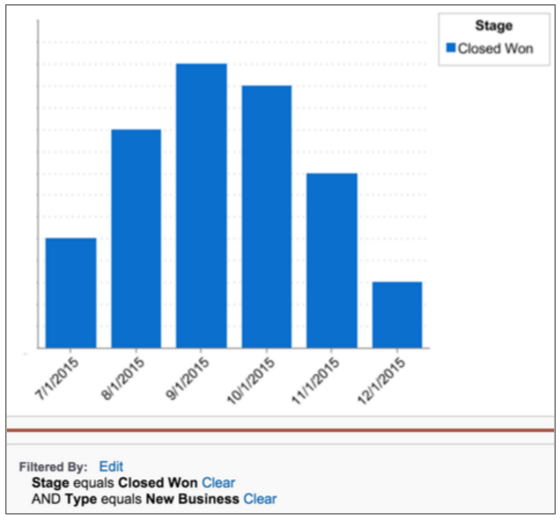
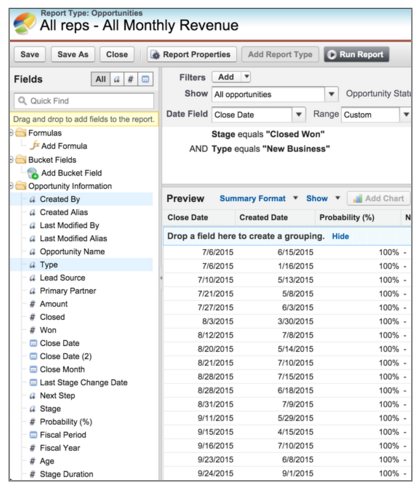
Answering the first question using Salesforce's filters is simple enough. Here we're looking at opportunities where the stage is “Closed Won” and the type is “New Business.”
 This six-line SQL query against a Redshift data powered by Pipeline provides the exact same results:
SELECT DATE_TRUNC('month', close_date) AS month,
       COUNT(*) AS closed_deals
  FROM rjm_current.sf_opportunity
 WHERE stagename = 'Closed Won'
   AND type = 'New Business'
 GROUP BY 1`
Let's break down how it works:
- The
SELECTfunction counts how many deals were closed each month. - The
FROMfunction shows which table we're querying:rjm_current.sf_opportunity - The
WHEREfunction returns the deals that have been'Closed Won'. ANDis a continuation of theWHEREfunction. It returns'Closed Won'deals that are also labeled with thetype'New Business'.GROUP BYgroups the deals by the month they closed. (Sincemonthis the first criterion mentioned, it will be displayed in the first column of the results table. That's why we refer to it as1here.)
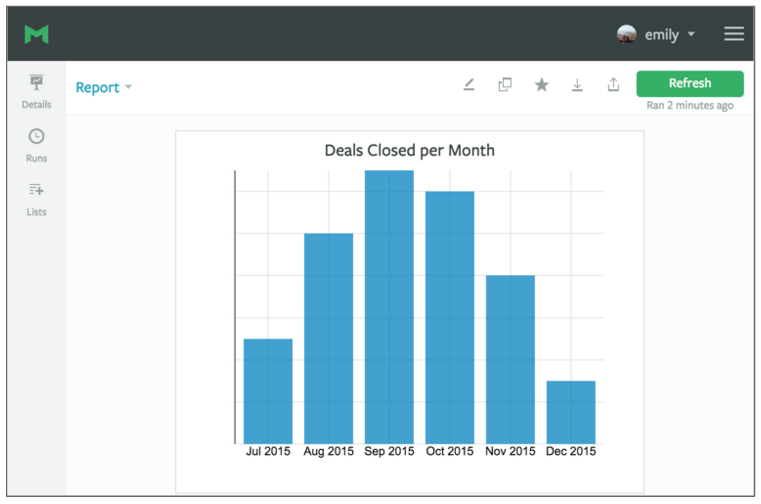
Notice anything similar? We're using similar terminology to the Salesforce filters. That's because as Salesforce data flows into your warehouse, the data structure and naming conventions are preserved. And, when it comes to the standard Salesforce fields, everyone's schema is exactly the same. That means you can copy and paste the query above into your own SQL editor to generate the data needed to create this chart for your company.
But this chart only answered the first question. We also want look at deal length. Of the deals in the previous chart, how many took one month, two months, three months, et. cetera, to close?
Here's where Salesforce hits a sticking point. While you could use the “Age” field, there's no flexibility to the calculation. You could try adding the “Created Date” field, but you can't do any math with it once it's in the report.
We could export the data into Excel, where it's easy to do this sort of calculation. Unfortunately, there are some big downsides: the data is no longer live, it requires manual updates, and after a certain scale, it becomes very hard to use. Bad news all around.
That's where a collaborative analytics platform like Mode comes in handy. Mode allows you to explore your data using SQL, visualize query results, and share analyses, all in one place. Plus, Mode is always connected to your database, so reports can be updated with one click.
Using SQL to perform this calculation is easy; we simply add one line to our original query:
SELECT DATE_TRUNC('month', close_date) AS month,
       DATEDIFF('month', created_date, close_date) AS age,
       COUNT(*) AS closed_deals
  FROM rjm_current.sf_opportunity
 WHERE stagename = 'Closed Won'
   AND type = 'New Business'
 GROUP BY 1,2`
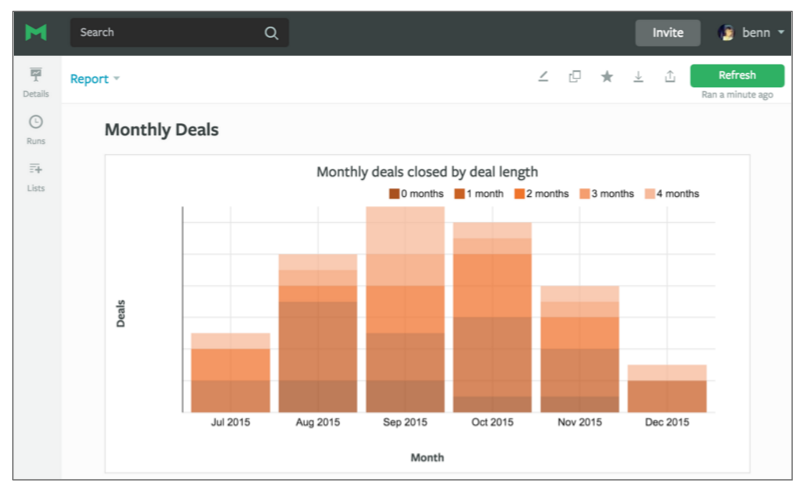
The DATEDIFF function in the second line calculates the time between when the opportunity was created and closed, allowing us to cohort opportunities by age. Now we can quickly visualize the cohorts and share the results with anyone, regardless of their Salesforce access.
Easy in SQL, hard in Salesforce
There are a whole host of other things that become much easier when you access Salesforce data using SQL. You can begin to ask really interesting questions like:
- How long does it take to get a prospect from one stage to another? How many days do prospects spend in the “in contact” stage before moving onto the “contract negotiation” stage?
- How likely is it that a deal will close once advanced to a certain stage? Instead of estimating close probabilities, you can calculate actual historical close rates and use those to make more accurate sales forecasts.
- How many touches are required to advance a deal? Does that vary by rep, industry, or stage?
SQL also lets you work around messy data. At some point, pretty much everyone's Salesforce data gets out of whack. Accounts are created twice, new salespeople mislabel accounts, and other data entry problems emerge.
If you’re working in Salesforce, you don’t really have a way to work around these issues. If you want to see new business, you get everything that’s flagged as new business (even if it's mislabeled).
SQL gives you the flexibility to work around these problems. In the new business example, instead of using the “New Business” opportunity type, you could write a query that finds the first “Closed Won” opportunity associated with every account. Plus, there are a whole host of SQL functions that can be helpful for inconsistent labels or weeding out duplicates.
The next level: combining product and CRM data
The fun really begins when you start to combine your CRM data with data that lives outside of Salesforce, such as the data from your production database, your help desk software, or your event tracking tool.
Here's an example (using sample data) of a tool our own sales team uses every day. We wanted to help them confirm that they are:
- Talking to the right people at a company
- Finding champions beyond their primary point of contact
The tool we built combines product and Salesforce data and uses a query that looks like this:
WITH sales_touch AS (
SELECT c.email,
       COUNT(*) AS touches
  FROM rjm_current.sf_account a
  JOIN rjm_current.sf_task t
    ON t.account_id = a.id
  JOIN rjm_current.sf_contact c
    ON c.id = t.whoid
 WHERE a.name = 'Octan'
 GROUP BY 1
),

product_activity AS (

SELECT u.email,
       COUNT(l.id) as logins,
       MAX(l.occured_at) AS last_seen
  FROM rjm_current.prod_users u
  JOIN rjm_current.prod_logins l
    ON l.user_id = u.id
 WHERE u.company_name = 'Octan'
 GROUP BY 1
)

SELECT a.email,
       a.logins,
       a.last_seen,
       t.touches
  FROM product_activity a
  LEFT JOIN sales_touches t
    ON a.email = t.email
 ORDER BY 2 DESC`
Let's take a closer look at what this query is doing.
- The first part (starting with
WITH sales_touch AS) uses Salesforce data to see how many times we've reached out to contacts at the company Octan. - The second part (starting with
product_activity AS) uses product login data to calculate how many times each user at Octan has logged in to Mode. - The third and final part (starting with
SELECT a.email) joins the first two parts, producing a list of logins and sales contacts by user at Octan.
The query produces a table that shows users' email, how often they've logged in, when they last logged in, and how many times the sales team has contacted them.
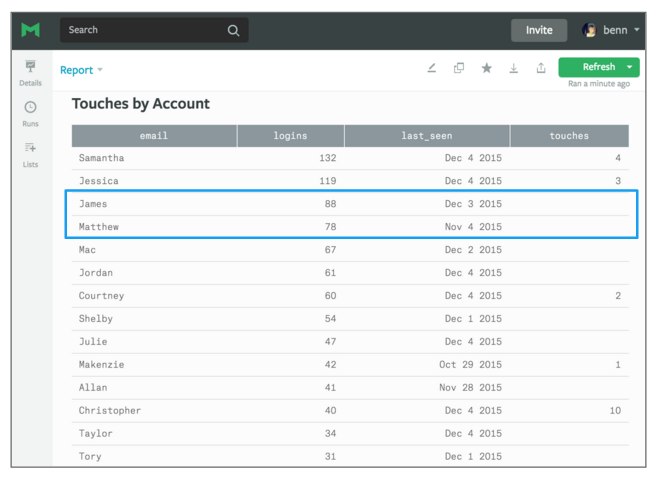
It looks like the sales team is doing a good job for this account. The top two users have been contacted a few times. But you'll also notice that we contacted Christopher the most, despite the fact that he's logged in less than half the times of our most active user, Samantha. That means the we might find success by focusing our attention on reaching other champions, like James, who we haven't talked to at all. We can also see that Matthew might have been a good person to reach out to, but he hasn’t logged in for a month.
This report is helpful, but it's not much use unless our sales team is looking at it every time they reach out to a prospect. By using query parameters (a feature unique to Mode's SQL editor), we can quickly turn the sales team's queries and reports into dynamic tools that can be reused by the rest of the business.
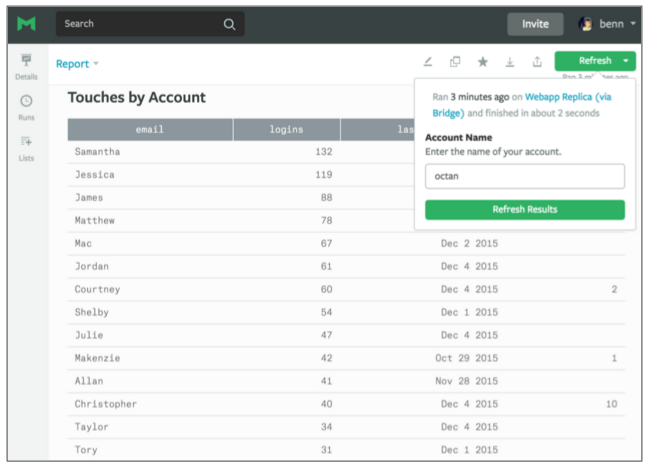
With parameters, the sales team can quickly type in an account name and rerun query, without ever touching code. Then, by incorporating the parameters into the report's URL, we can enable someone to rerun the report, just by clicking a link.
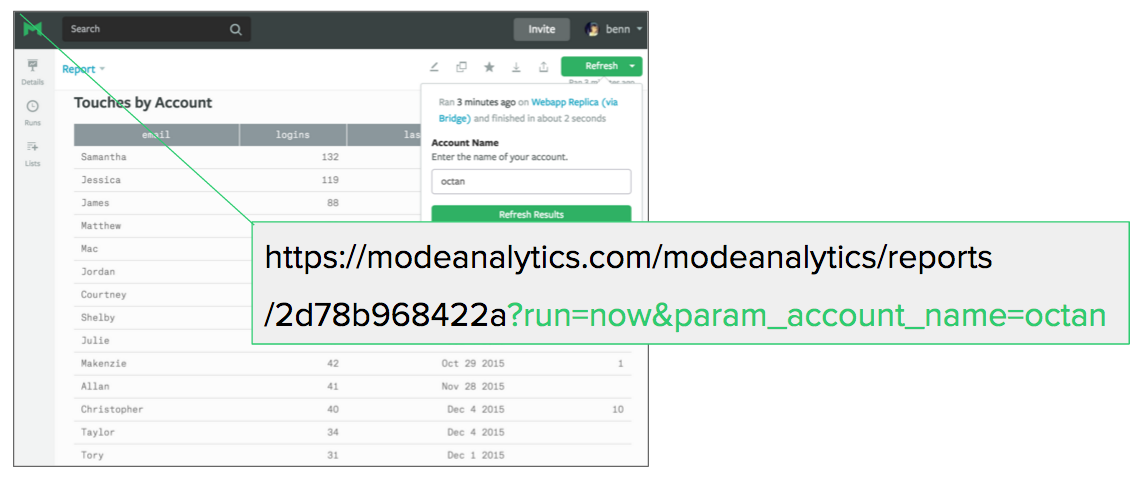
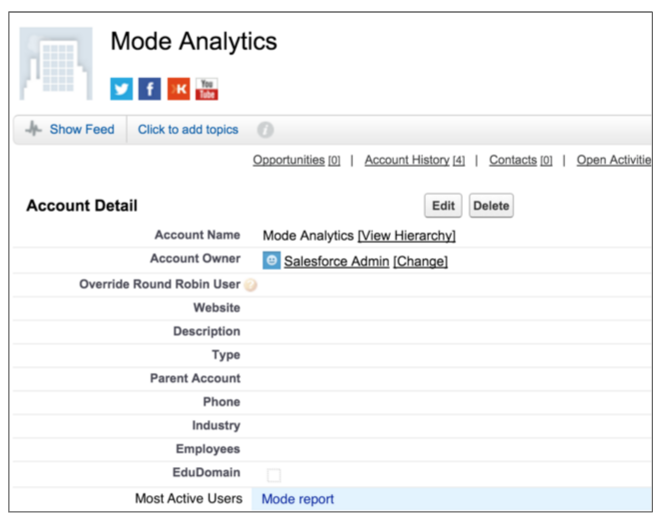
We've created a custom field in Salesforce that automatically generates the report's URL based on the account name. Now, whenever our sales team looks at an account in Salesforce, all they have to do is click a link—and deep account insights are at their fingertips.
More combinations = more insights
This is just one use for combining data from multiple sources. There are lots of other data sources you could combine with Salesforce and lots of other questions you could answer.
- Who were the most active users in the last week? If you have a new champion at an account, make sure to reach out to them while they’re still in the honeymoon phase with your product.
- Who had a great experience with support? This is another indicator of potential champions. If you integrate your support center data, you can see who’s had tickets closed quickly, or who’s rated your support team highly.
- Who should I avoid reaching out to? Who hasn't logged in a lot recently? Who’s submitted a lot of support tickets? You might not want to reach out to someone who doesn't use your product much or had a lousy experience with support.
So there you have it. Salesforce is great at what it does, but when it comes to answering complex business questions, integrating your data sources, and doing analysis, SQL is the best tool for the job. Sign up for Mode and give it a go—we're happy to help you get started!

