


For many of Mode's employees, this is their first job at an analytics company. Those team members often assume that Mode's internal analytics processes mirror the way analysis is commonly conducted within other organizations. In some ways, that assumption holds true. As CEO Derek Steer puts it, "I wish I had a more mind-blowing story for how we do internal reporting... But mostly, it's funnel analysis." That said, we approach analysis from some uncommon angles.
Frequently, we begin an analysis with a one-off report, rather than setting out to build a big dashboard. Many of our most technically proficient internal users, who produce some of our best analysis, are on the Customer Success team. And reports that are built with one purpose often find extended lifespans as reusable tools. In this post, we'll take a look at some of the uncommon analytics practices internally at Mode.
Fewer Dashboards, More Questions
Mode's dashboard capabilities provide a compelling way to engage with data. But we devote less of our attention than you'd expect to high-level views of company-wide metrics. Most of our questions require a deeper dive.
Joel Carron, an analyst here at Mode, elaborated; “We do have dashboards, but more analytical work goes into answering the questions that people have after seeing the dashboard.” The dashboard points in the direction we need to look, and the deeper ad-hoc analysis ultimately informs decisions.
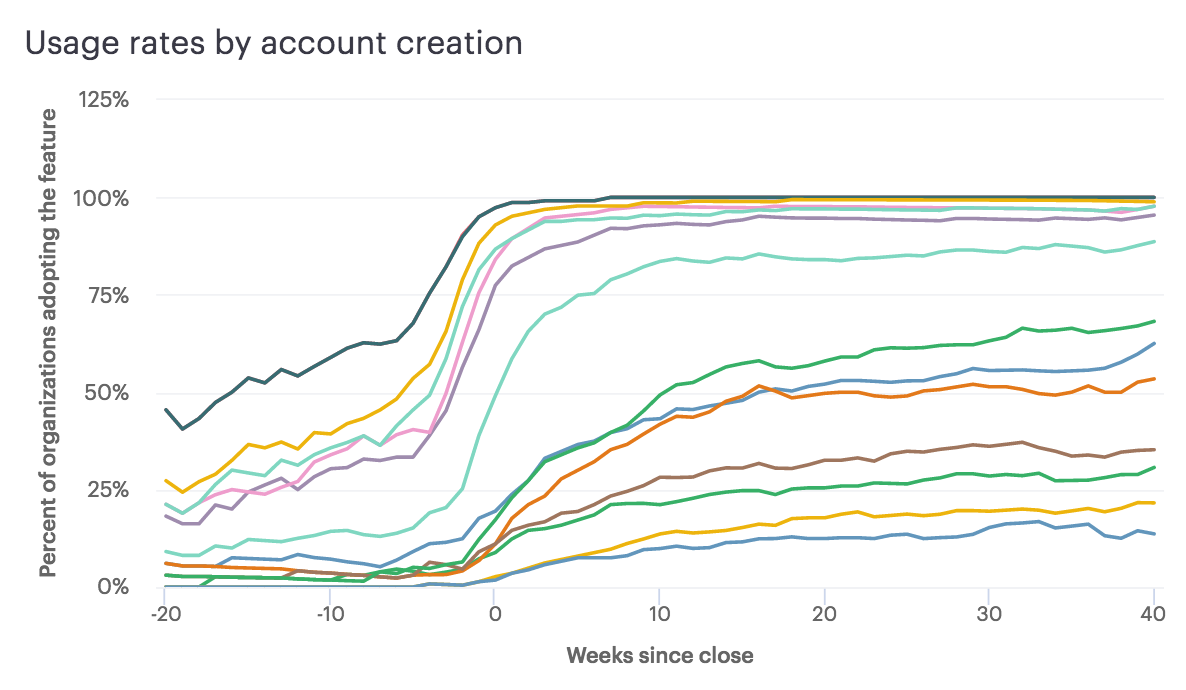
Creating Mode Studio, for example, required extensive analysis of product usage and feature adoption. To create a complete analytical toolkit, we needed to understand the core requirements of analysis. Behavior data convinced us we'd need to build a platform that could support analysis for multiple users, and let them share their work. These features form the core of the Mode platform and create a comprehensive analytical experience.
When the same question arises frequently, these reports may take on an afterlife — more on that below.
Power Users in Customer Success
Another anomaly within Mode's analytical apparatus is that the savviest analysts are on our Customer Success team. Jon Krangel, Head of Customer Success, explains that though he's “worked in a variety of customer success capacities, this is the most technical.” Mode's mission has attracted an inquisitive, talented bunch to the table. “They enjoy working on a product made for complex problem solving.”
Every member of Mode's support team wears many hats. They must simultaneously play the roles of analyst, front-end developer and database administrator in order to help our customers navigate the modern analytics ecosystem. They tackle questions ranging from basic SQL syntax, HTML and CSS styling, to issues on various data source connections, in real time, at scale, to support Mode's customer base.
How does our six-person team know each of these data sources, languages and syntaxes inside and out? The short answer is, they don't.
“The most successful folks are really good at learning quickly, parsing answers and finding information,” says Jon. Additionally, each person on the team brings one or more specialized skills, such as wizardry in R, or a swift eye for SQL errors. Anyone on the team can answer nearly every question, while also bringing to the table specific excellence in their respective domain. As Jon says, “No one is ever shrugging.”
Data Tools: Reports That Stick
One of the most valuable facets of Mode's internal analytics culture is how well the reports and knowledge created by the support team are repurposed for other means. The problems that begin as a frustrated message to support frequently generate answers and resources in the Mode Gallery. Leqi Long, our Customer Success Engineer, built out a Zipcode choropleth map after a conversation where a customer was looking to illustrate geographic distribution with that level of granularity. We'd previously had choropleth maps that offered global and country distribution, so it was a natural progression to support zip codes. The Customer Success team builds data tools for the gallery when a question reoccurs, so the entire Mode Community can benefit from the curiosity of others.
A great example of a report that has stuck around is one Mode's sales team uses on a daily basis: the Org Stats report. This report is a data tool Joel built to gain a high-level understanding of product activity by an organization. Account Managers and Executives review the tool before customer and prospect conversations, so they can come in prepared with advice and bring attention to features that may not yet have been adopted by their team. The sales team primarily works in Salesforce, so the Org Stats report is embedded there for easy access. This report enables the sales team to provide a custom-tailored experience to our customers without writing code or disrupting their normal workflow.
We build and use data tools that help us maintain a progressive product roadmap, as well track progress towards our goals. In the lead-up to the release of Mode Studio, our free analytical toolkit, we built reports to measure adoption, retention and product behavior. Our analytical focus continuously shifts as the Mode platform evolves to meet the needs of analysts. As Jon says, it takes a Swiss army knife style tool, one with flexibility, to scale analytics.
Is It That Weird?
Joel's first comment when asked to chat about our predilection for ad hoc reporting and data tools, was “I don't think Mode is that weird.” We hope that becomes increasingly true. We use analysis as a way to be proactive, rather than reacting to a spike or dip on a dashboard. Analysts have the potential to provide immense value to organizations and push their teams forward. But to do so, they need the freedom to be flexible.
Each new question, and the analysis it inspires, needs an environment for creation and iteration to find a worthy answer. To answer the ever-present question of “what next?” check out Mode Studio.
Related Articles

