


Mode recently released a big update to our collaborative analytics tool. The new features were informed by a careful combination of product usage data analysis and qualitative feedback from users.
As the only designer on a team founded by two analysts and a data engineer, I'm surrounded by an avalanche of quantitative data (and people who love to analyze it). Our team can find a quantitative answer to just about any question we have: How many lines are typical queries? How many people use the reference bar and pinning features?
But access to data doesn't make design research obsolete. In fact, it makes design research more important than ever. A huge part of my job as a designer is to help the team understand the whys—a behavior's motivation—that exist during an analyst's everyday workflow. Here's how we work as a team to mix data analysis with design research to build better features for our customers.
Group Users in Concentric Circles
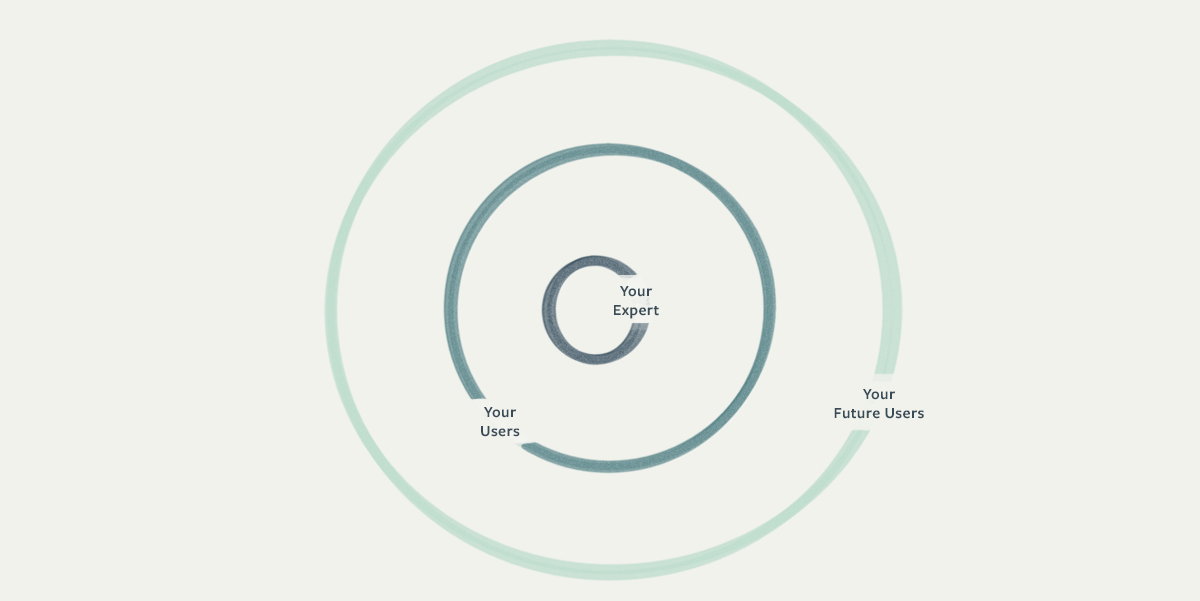
I like to bucket design research subjects into a set of concentric circles—and talk to each group often. At the center are the the folks closest to you—experts who can give you fast feedback. In our case, we're a company full of analysts building analysis software so it's as easy as an intra-office conversation.
The next outward group for us is our early and highly-engaged customers. For companies building software for people they don't have on staff, foster this group early and make them your “inner circle.” Expanding out again are people with decreasing levels of familiarity with the product; they have very different perspectives from folks who use it every day—and represent our future market.
Start with the Experts Closest to You
I'm not an analyst. I know SQL, and have a basic understanding of statistics, but my mind isn't wired the same way as a top data analyst's mind. So when I hear Benn (our Chief Analyst) groan while using our product, I always ask what's up.
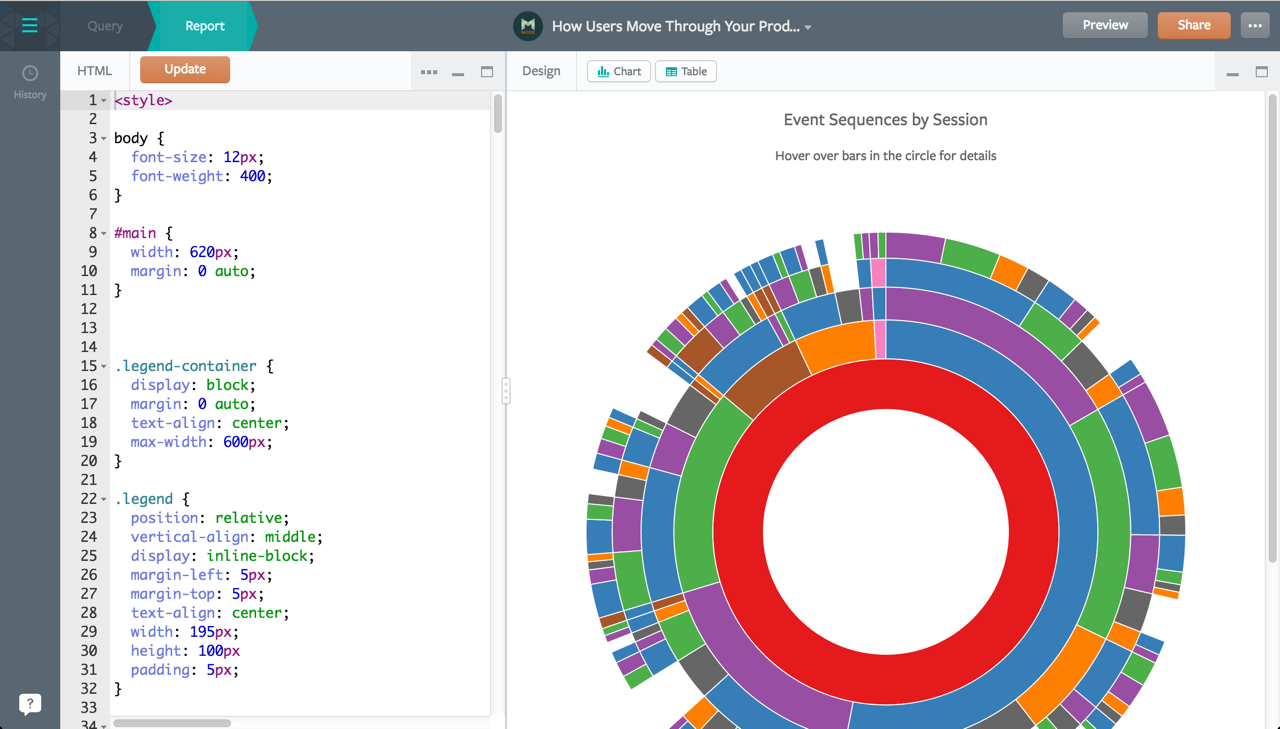
One of these moments happened a few months ago as Benn was working to build out a library of awesome D3 visualizations (the “Mode Playbook”). He would publish an in-progress report so he could preview it in a separate tab. Watching him flip back and forth between tabs in order to see how his code changes affected the output really surprised me: surely there was a more efficient way to preview work as it was happening.
So we looked to data to validate what we were seeing Benn do. How many customers were actually using the HTML editor? It was near zero. Had we looked at the data alone, killing the feature might have been a possibility. But by going back to Benn to talk more about his process and really dig into where he was hitting roadblocks, we had a feeling the low usage was because of a tough experience, not because users didn't want the functionality.
In the end we added the ability to preview reports side-by-side with code. Though it's a bit early to tell, initial feedback from our next-bigger circle of influencers—our super-active users—indicates that this functionality will be used more going forward.
Look to Users Writing In
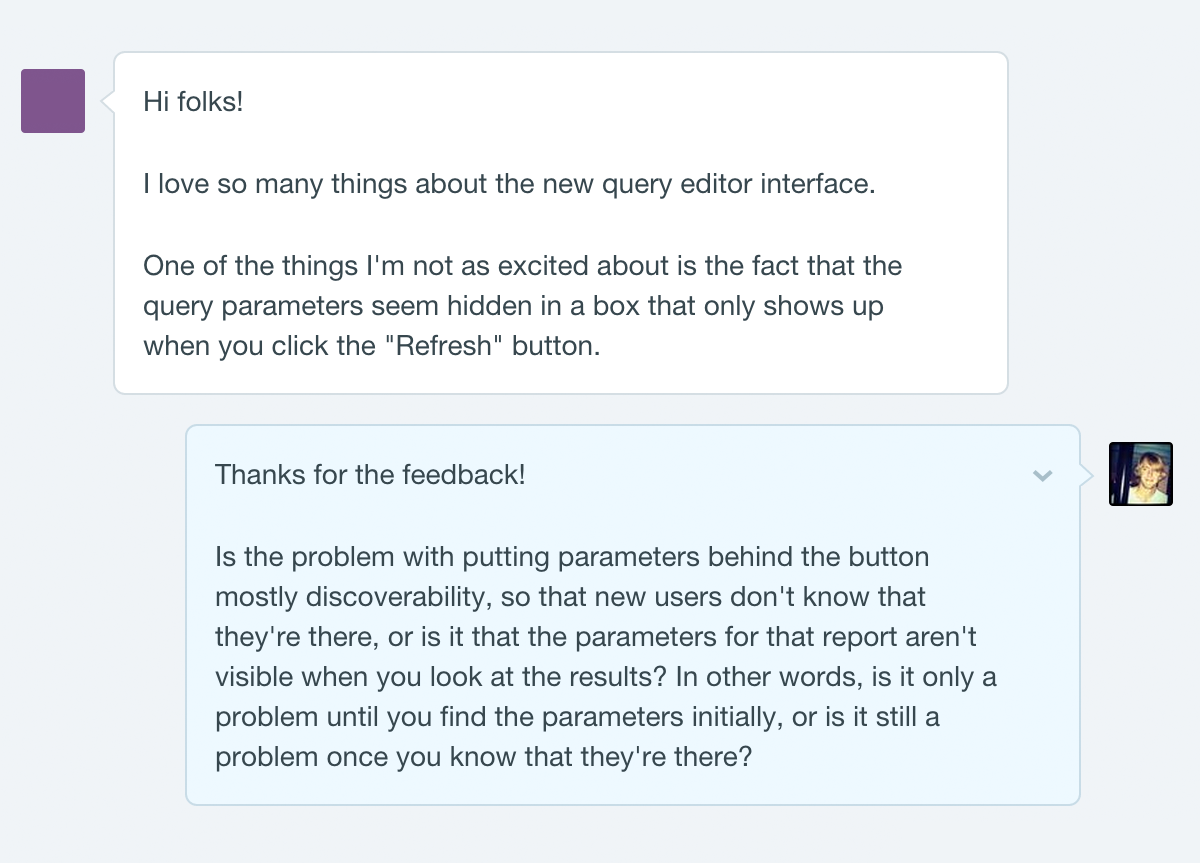
We can't rely solely on our own opinions, however. To expand our feedback loop, we start with inbound feedback and support issues from users. Since day one, Intercom has enabled us to chat with folks as they're using the product, identify common problems, and gather more information on the spot. This is where the iterative process of data analysis and design research really starts to pay off.
One of the most common requests we'd heard was for a schema browser (a classic feature of desktop-based SQL editors that helps analysts explore their databases). The editor folks were using had a feature I had designed called the “reference pane”; it enabled analysts to search for a table or report and pin it for reference as they wrote a new query. We thought there were aspects of the reference pane that made it more helpful than a traditional schema browser. But when we looked into the feature usage data, we discovered that people were pinning tables, not reports—they were, in essence, mimicking the functionality they were requesting.
I set up a few meetings with some of the folks who had written in with the request. By talking with them about their process, I learned that analysts don't necessarily have their databases memorized and tables are often named in a less-than-memorable fashion. Users agreed that if they knew what they were looking for, the reference pane was cool. But at this point in their workflow, they needed to browse, not search.
I quickly built a prototype in JavaScript of the schema browser, using popular music production software as inspiration. Days later, I was able to show it to the same folks I had interviewed and get their input. Within a week, it was ready for internal use and we refined it—with the help of our inner circle—as we built out other aspects of the new workflow.
Since the launch, we've continued our research by listening to what our customers are saying. Just as no software is ever “finished,” we know the new editor isn't perfect yet. We treat every piece of feedback as a valuable data point. And since our entire team has gotten used to probing for the whys of our users' problems (i.e., thinking like a designer), we're pre-building the context we'll need when we have enough quantitative usage data to start analyzing.
Value the People Who Don't Use Your Product
Understanding the way customers currently use the product is all well and good, but what about our long-term vision? How do we prioritize feature requests from current users with our longer-term vision of where the product should go? How do we built an interaction model that will support work that doesn't exist in the product yet?
The early design research I led as we were first getting started continues to help us steer the ship in uncharted (read: unanalyzed) waters. During my research, I talked to many types of analysts and data scientists to understand which tasks in their daily workflow were shared. Though specifics varied—for example, some use SQL and others work strictly in Python—a theme began to emerge around the core workflow: it always starts with data exploration and then moves into reporting.
We had no raw numbers to indicate this; in fact, no one ever explicitly asked for a two-step workflow. But when we reorganized the editor's core components into “Query” and “Report” steps for the recent launch and showed it to users, it made perfect sense to them.
And now, we have the room in our editor to expand out to more complex workflows. Multiple queries per report, WYSIWYG charting, and advanced features like R and Python now have a home to live in when we're ready to build them.
Strike a Balance
At a startup, design research can be a costly endeavor. Talking to folks who don't use your product can be expensive and time consuming, but also can provide you with valuable guidance. Designing for your needs only is faster and cheaper, but you run the risk of limiting your audience—and growth potential. And only listening to raw usage metrics can give you an incomplete view of your product's current and potential users.
Like most things in life, a holistic approach is usually best. At Mode, coupling metrics with feedback has led us to insights that help us make the best decisions for our users.
P.S. We're looking for a stellar designer to join our growning team. Interested in learning more about what we're tackling next? Drop us a line at jobs@modeanalytics.com.

